
and the growth of Mega Cities Shanghai pop 18 million 2010 TO BE MEGACITIES IN 2015 Country Urban agglomeration 1950 1975 2000 2015 Japan Tokyo 6 920 19 771 26 444 27 190 ID: 546435
Download Presentation The PPT/PDF document "Urbanisation" is the property of its rightful owner. Permission is granted to download and print the materials on this web site for personal, non-commercial use only, and to display it on your personal computer provided you do not modify the materials and that you retain all copyright notices contained in the materials. By downloading content from our website, you accept the terms of this agreement.


Slide1
Urbanisation
and the growth of Mega Cities
Shanghai – pop 18 million 2010Slide2
TO BE MEGA-CITIES IN 2015
Country Urban agglomeration 1950 1975 2000 2015 Japan............................ Tokyo 6 920 19 771 26 444 27 190
Bangladesh .................. Dhaka 417 2 173 12 519 22 766
India ............................ Mumbai (Bombay) 2 981 7 347 16 086 22 577
Brazil........................... São Paulo 2 528 10 333 17 962 21 229
India ............................ Delhi 1 391 4 426 12 441 20 884
Mexico......................... Mexico City 2 883 10 691 18 066 20 434
United States ............... New York 12 339 15 880 16 732 17 944
Indonesia ..................... Jakarta 1 452 4 814 11 018 17 268
India ............................ Calcutta 4 446 7 888 13 058 16 747
Pakistan ....................... Karachi 1 028 3 990 10 032 16 197
Nigeria......................... Lagos 288 1 890 8 665 15 966
United States ............... Los Angeles 4 046 8 926 13 213 14 494
China ........................... Shanghai 5 333 11 443 12 887 13 598 Argentina..................... Buenos Aires 5 042 9 144 12 024 13 185
Philippines................... Metro Manila 1 544 5 000 9 950 12 579
China ........................... Beijing 3 913 8 545 10 839 11 671
Brazil........................... Rio de Janeiro 2 965 7 963 10 652 11 543
Egypt ........................... Cairo 2 410 6 079 9 462 11 531
Turkey ......................... Istanbul 1 077 3 601 8 953 11 362
Japan............................ Osaka 4 147 9 844 11 013 11 013
China ........................... Tianjin 2 374 6 160 9 156 10 319Slide3
Megacities are often
primate citiesPrimate cities (at least double the pop of the second largest city in the country) are typical of many LEDCs and NICs.
The city dominates the country’s urban system and economy.
Advantages and disadvantages of primate cities?Slide4
List of Primate Cities
http://en.wikipedia.org/wiki/User:Two_divided_by_loveSlide5
Sustainable city
Maintain population, particularly economically active people. Develop human resources.
Economic growth.
Infrastructure and urban services.
Quality of life.
Environmental impact. Ecological footprint.
Circular metabolism.
Green design and architecture.
Energy efficiencies. Carbon neutral city. (
Masdar
)Slide6
Land UseSlide7
What do we use land for?
RICEPOTS!HousingShoppingIndustry
Commerce
Businesses
Recreation
And Many More!Slide8
Urban Land Use Model – burgess
The Model above is a typical Land Use model. What are zones A, B, C and D? Why? Slide9
A – the centre, known as the
Central Business District (CBD). Shops, offices, banks and main services are found here.B – the Inner City area, older housing (19th Century). Today this is more modernised.C – the
Suburbs
, mostly house built in the 1920s or 1930s. People still wanted to live near the centre for work but no more room.
D – the
Edge of City
, often more leafy areas. It has been common in recent times for shops and industry to move here to reduce
congestion
in the city, and for the cheaper land and better accessibility. Slide10
A – THE CBDSlide11
A – THE CBD
High cost of landHigh-Order shops, public buildings, entertainment etc.Often divided into districts eg. Entertainment area
Also can be ‘zoned vertically’ – ground floor shops, first floor offices etc; cheaper rent
Much traffic in certain areas
Usually the oldest and tallest buildings
Low population density normally
Mostly younger people without familiesSlide12
B – INNER CITY – OLDER HOUSINGSlide13
B – INNER CITY – OLDER HOUSING
Quite high cost of landWas C19th terraced housing and factories, now with urban regeneration, some new housing and industryOften see ‘grid-iron’ pattern of streets
High traffic, due to factories and population
Generally C19th buildings, some new
Tall buildings; were packed together (high density), now less so
High population, although lowering. People moved due to crime etc., but now many are returning
In C20th generally poorer groups of people, immigrants etc., although now much more of a variety Slide14
C – SUBURBSSlide15
C – SUBURBS
Middle and high cost housing; generally low land value but high building valueDetached/ semi detached housing; housing estates; parks; golf courses etc.Access roads, maybe cul-de-sacs, crescents etc.
Little traffic, away from main roads
Mostly C20
th
buildings
Low buildings and low density as low cost of land; also need space for greenery etc.
Population density is quite high, tends to be more affluent groups – middle aged couples and families etc.Slide16
D – EDGE OF CITY INDUSTRIAL AREAS/ SHOPSSlide17
D – EDGE OF CITY INDUSTRIAL AREAS/ SHOPS
Quite low land value, but getting higher – accessible and zonedModern factories, offices; middle and high order shops; lots of space for car parking
High traffic at rush hours and peak shopping times
Very new buildings, generally low density
Low population density
Study models on pages 492, 493, 494 and 495. In what ways to land use models/ patterns contrast in MEDCs and LEDCs?Slide18
Terms
PVLIDistance-decayBid Rent TheoryUrban morphologySlide19
Developed in the 1930s by Homer Hoyt this model took into consideration road, river and rail links which may affect the zoning. It is sometimes called the sector model. Describe it using the key to help you.
The Hoyt ModelSlide20
1
Historical
The urban area expanded outwards from the original site which is the CBD.
2
Economic
Rent in the CBD became too expensive for people. In the suburbs there was more land and it was cheaper. Only businesses could afford to stay in the CBD.
3
Concentrations of similar land uses
One part of the urban area may have all the advantages for industrial location so that a lot of factories want to locate there; but few people want to live next door to a factory, so the residential areas are located elsewhere.
There are 3 explanations for these land use patterns.Slide21
SIMILARITIES
DIFFERENCES
Create a table to show similarities and differences between the two models.Slide22
It is a model so may not be able to be applied to a specific city.
Like the Burgess model it was designed before the car so doesn’t take commuting into considerationPhysical features may limit the growth of a zone.
Can you give an example?
LimitationsSlide23
Land Use ShanghaiSlide24
Basic urban model for an LEDC city.
Higher cost housing and higher class residential areas located centrally. Historical core of colonial city. Rapid urban growth expanding the peripheral areas.Slide25
The CBD is always in the middle
There is no zone of medium class residential in the LEDC model
The poorest housing is found of the edge of the LEDC city
The largest zone is the shanty town. Often called squatter settlements, slums or favelas
You should have identified:Slide26
Urban growth is too rapid for planners and for the city to provide basic urban infrastructure, housing and services. Peripheral areas
characterised
by poor quality housing and spontaneous settlements as immigrants attempt to satisfy their basic needs of housing and employment through the informal economy.Slide27
Urban stress and sustainable solutions in LEDC cities
Dhaka
Mexico City
Shanghai
Rio de JaneiroSlide28
What are the challenges facing an (LEDC) city?
Housing the urban poorSocial deprivation, crime and inequality
Employment
Air / water pollution
Waste management
Transport
Energy
Water and food supply
Public spaceSlide29
Caracas - VenezuelaSlide30
Rocinha
– Rio de Janeiro BrazilSlide31
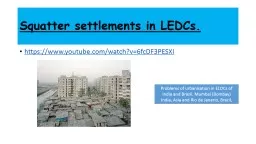
Squatter Settlements
Residential areas which have developed without legal claims to the land and/or permission from the concerned authorities to build; as a result of their illegal or semi-legal status, infrastructure and services are usually inadequate.
30% of the urban population of the world live in squatter settlements. 1 billion people!Slide32
http://www.ted.com/talks/robert_neuwirth_on_our_shadow_cities.html
Watch Richard
Neuwirth’s
TED presentation on his book
Shadow Cities
He presents an empathic and positive view of squatter settlements and their role in modern cities. Slide33
The role of the Informal Sector
This whole process of urbanisation
and urban growth is a sum of millions of people’s individual decisions, aspirations, hopes and desire to provide for their loved ones.
As the governments are unable to provide solutions, then these individuals, faced with these problems are struggling to find their own solutions to their housing and employment needs.
This is why squatter settlements play such a vital role in the process of urban growth we are witnessing now in the world.Slide34
Is it possible that squatter settlements, shanty towns,
bustees,
favelas
, slums are part of the solution?
Or perhaps is it true that they are a potent symbol of the failure of society to address the basic needs of the majority and it must be the responsibility of the public sector to provide housing for its citizens?
Slums of hope or slums of despair?Slide35
Problems of the informal economy
Low profit
No money
No investment
Low outputSlide36
Turner’s model can be linked to a intra-urban movement of migrantsSlide37
Planet Geography pg 534
Huge gaps between rich and poor in LEDCs?Shanty next to high riseTNCs create jobs – only for educatedThe rich get richer....LEDCs rapidly changing?
DTM?
Shanghai growth
Globalisation and ‘copying’ MEDC growthSlide38
AIR POLLUTIONSlide39
Why have the problems developed?
What is the impact on the city? (environmental, economic, social)Slide40
LEDCs
Some of the worst air pollution is now in LEDCs or ‘NICs’ – figure 11.131 pg 546Beijing example; page 551Slide41
Urban Microclimates
A microclimate is a local atmospheric zone where the climate differs from the surrounding area. The term may refer to areas as small as a few square feet (for example a garden bed) or as large as many square milesWhy might an urban area have a ‘microclimate’?What is meant by an ‘urban heat island?’ – q block 11O page 551.Slide42
Other ‘Social Stresses’
Using pages 556-565 list the ‘other’ social stresses which appear in urban areas.Complete questions 1,2,3,4,7,8,10 and 12 pg 566Slide43
Urban Stress in London
Usual problems – pollution, traffic, overcrowdingHuge gap between rich and poorInner city urban blight – poor, old housing (East End), schoolsHigh rise estates to make up for shortfall (600,000)These areas associated with crime, violence and
Graffiti.Slide44
Urban Stress in London
Huge range of migrants (former port city)1960s from former colonies in Asia (Pakistan, Sri Lanka); East Africa (Uganda) and in the 1980/90s large numbers of refugees from eg Afghanistan, Iraq.Creates ‘urban villages’ where people cluster, creates a ‘hotbed’ of culture in LondonHas led to some hostility and racism
History of riots in the city – Brixton (25% population of different racial background)Slide45
However...
Not ALL bad!‘In a 100m stretch in Finsbury Park can be seen an Irish pub, Indian newsagents, food shop and restaurant, West Indian businesses, West African restaurant, Chinese take away, Lebanese flower shop, Jewish run ironmongers, Italian restaurant, Spanish off-licence... This rich mix of cultures rubbing alongside one another that characterises contemporary London and adds so much to its vitality’Read pgs570-577; q’s 1, 5, 7, 8, 9Slide46
The Sustainable City
Can a city be ‘sustainable’?‘A sustainable city, or eco-city
is a city designed with consideration of environmental impact, inhabited by people dedicated to minimization of required inputs of energy, water and food, and waste output of heat, air pollution - CO
2
, methane and water pollution
’Slide47
How does a city attempt to manage the problems it faces?
Socially sustainable housing management strategy.
Environmentally sustainable pollution management strategy.
A strategy to control the growth of the city.
Also perhaps sustainable management related to social welfare, waste, energy, transport etcSlide48
Sustainable Housing
What is done to provide socially sustainable housing for the urban poor?Affordable housing provided by government or private sector
Upgrading squatter settlements
Slum clearance and relocation
Site and service schemes
Loans for people to buy housing
Other options in London, Shanghai
or Beijing?
- Can a ‘system’ be in place?
Study figure 11.238
pg
582
Complete q’s 2 and 3
pg
584Slide49
London – Sustainable?
TASK:Read pgs 584-590 and make a table
SUSTAINABLE YES
SUSTAINABLE NO
INNER
CITY CONGESTION CHARGE
45,000 TONNES OF FUEL TO POWER THE
CITYSlide50
Evaluation of strategy
For example – a relocation and re-housing project
Availability of land
Distance from employment for residents
Cost of projects
Poor standard of housing
Lack of urban services provided
Social fabric of squatter settlement broken up
Pointless as residents of squatter settlements have already built their dwellings
Alternative is to upgrade existing squatter settlements and integrate them into the city.
Favela
Bairro
project.