
Era California Association of Healthcare Purchasing amp Materials Managers Shell Beach California October 2014 Aman Sabharwal MD MHA CPHM SVP of Clinical Resource Management Introductions ID: 931438
Download Presentation The PPT/PDF document "Engaging Physicians and Suppliers In The..." is the property of its rightful owner. Permission is granted to download and print the materials on this web site for personal, non-commercial use only, and to display it on your personal computer provided you do not modify the materials and that you retain all copyright notices contained in the materials. By downloading content from our website, you accept the terms of this agreement.


Slide1
Engaging Physicians and Suppliers In The Value Based Purchasing EraCalifornia Association of Healthcare Purchasing & Materials ManagersShell Beach, CaliforniaOctober 2014
Aman Sabharwal, MD, MHA, CPHM
SVP of Clinical Resource Management
Slide2IntroductionsAman Sabharwal, M.D., M.H.A., CPHMSVP Clinical Resource Management, MedAssetsPracticing HospitalistClinical Assistant Professor of MedicineUniversity of Miami Miller School of Medicine
Florida International University College of Medicine
14+ years healthcare experience
Areas of expertise
Clinical Efficiency
Quality & Utilization
Slide3Impact of Healthcare Reform
Slide42009
2010
2011
2012
2013
20142015EMR/Meaningful Use PHASE 1PHASE 2PHASE 3Healthcare Reform 3/2010Implement expanded insurance coverage, Medicaid expansion.Health Insurance Exchanges DataValue Based Purchasing Yr 1 –F2013 on F2012 Performance.Value Based Purchasing Continues. Penalties and Rewards increase for Quality Performance.Comparative EffectivenessAccountable Care Organization Program Jan 2012 Payment Bundling Pilot Program Jan 2013 30 Day Readmits Program FY2013ICD10 Compliance – 10/2014 ?Hospital Acquired Conditions Program F2015. Readmission Reduction Program
CMS - from Fee For Service Volume Model Transition to…..Value – High Quality/ Low Cost
4
Slide5Value Based PurchasingRequired by Congress under Section 1886(o) of the Social Security ActNext step in promoting higher quality care for Medicare beneficiaries
CMS
views value-
based purchasing
as an important driver in revamping how care and services are paid for, moving increasingly toward rewarding better value, outcomes, and innovations instead of
volumeLegislation requires that the FY 2013 Hospital VBP program apply to payments for discharges occurring on or after October 1, 2012Hospital VBP measures must be included on Hospital Compare website for at least one year and specified under the Hospital IQR program 5
Slide6Value Based PurchasingVBP was established by the Affordable Care Act of 2010 (ACA)Budget neutral payment changes begin October 1, 2012
Physician payment changes begin January 1, 2015
Rewards
for achievement or improvement
6
Slide7Impact on Hospitals 7
Slide8Imperatives for Hospital’s Future SuccessManage costs to reimbursementEducating providers about marginEducating providers about reimbursement schemesAlign incentives for hospital, physicians and non-acute providers (preparation for ACO)
Migrate from fee-for-volume to fee-for-quality
Value Based Purchasing
Focus on chronic disease management
Bundled payments
Episodes of care*Source: Modern HC 6-29-09, pg 16 MEDPAC. FierceHealthFinance, 12-15-09
Slide9Source: CMS QualityNetValue-Based PurchasingCongress authorized CMS to reduce the reimbursement of over 3,000 hospitals in the Affordable Care Act to reinforce improving healthcare quality, including the patient experience and efficiency.
Hospitals have an incentive to improve quality and earn the reimbursement back by achieving higher than average quality
scores.
Simply stated, hospitals with below average quality provide the incentive pool via CMS fund the bonus payments for those above average.
This money is then redistributed to hospitals based on the quality of care.
Slide10Reimbursement @ Risk Increases Annually+ Incentives Lost to Competitors Add to Cost of Poor Quality
Slide11Funding Value Based Purchasing 11
Slide12Earning Your ScoreAchievement or ImprovementAchievement 0-10 pointsImprovement 0-9 pointsHighest of either score used
Achievement Points
Must meet threshold (performance at 50
th
percentile)
Based on where performance fallsImprovement PointsPerformance compared to baselineCMS: no full credit for improvement 12
Slide13FY 2013 Domains & Measures
13
Slide14Eligibility for VBP MeasuresHospitals with at least 10 cases for at least 4 applicable measures during the performance period receive a Clinical Process of Care score
Hospitals
with at least 100 Hospital Consumer Assessment of Healthcare Providers and Systems (HCAHPS) surveys during the performance period receive a Patient Experience of Care score
14
Slide15Who Gets Impacted 15
Median
Hospital A receives payment incentive
Hospital B loses 1%
Hospital C receives payment incentive
Slide16FY 2013 Timeline 16
2013
2012
2011
July
MarchFY 2013 Performance PeriodAugEstimated Payment Adjuster DeliveredNovFinal Payment Adjuster Delivered 20102009JulyMarchFY 2013 Baseline Period
Slide17FY 2014 Domains & Measures
17
Slide18FY 2014 Timeline 18
2013
2012
2011
April
DecemberFY 2014 Performance Period 20102009AprilDecemberFY 2014 Baseline Period
Slide19FY 2015 Domains & Measures 19
1. MSBP-1. Medicare Spending Per Beneficiary (MSPB) Measure
Slide20FY 2015 Patient Safety Composite Index 20
Slide21FY 2015 Timeline 21
2013
2012
2011
Various
DecemberFY 2015 Performance Period 20102009VariousVariousFY 2015 Baseline Period
Slide22FY 2016 Domains & Measures 22
Slide23FY 2016 Timeline 23
2014
2013
2012
October
JulyFY 2016 Performance Period 20112010OctoberJulyFY 2016 Baseline PeriodJanuary
Slide24What’s New for FY 2015-2017?Readmission Reduction Program2013AMI, Pneumonia, Heart Failure2015
COPD, Total Hip Replacement, Total Knee Replacement
Hospital Acquired Condition (HAC) Reduction Program
I
n
tandem with the Value Based Purchasing Program (VBP) Top 25% for HAC rates will receive a 1% reduction in their overall Medicare reimbursement rate
Slide25CMS Hospital Acquired Condition Reduction Program
Slide26Impact on Physicians 26
Slide27Impact on PhysiciansStreamlined insurance claims processingReduces physician practice overhead10% incentive Medicare payment for PCP 10% incentive Medicare payment for Gen Surgeon in rural setting
5% incentive for mental health services
Increases Medicaid payments to PCP to Medicare level
Extends PQRS
Value-Based Payment Modifiers
Expands preventive and screening benefitsTransparencyDrug/device company disclosuresLimits on physician owned hospitalFunding to test medical liability reformsEx: health courts and disclosure laws 27
Slide28Eligible Practitioners (PQRS)
28
Slide29Value-Based Physician Payments ModifierSection 3007 of the Affordable Care Act mandate CMS applies a value modifier under the Medicare Physician Fee Schedule (MPFS
)
Both
cost and quality data are to be included in calculating payments for
physicians
Value ModifierPhysician or group differential payments based on quality and cost of care delivered (PQRS)Rewards practitioners for doing the “right thing” for the patientTimelineDifferential payments begin CY 2015Performance periods begin CY 2013 29
Slide30Physician Domains & Measures
Slide31Physician Modifier Penalties & IncentivesPenalties used to cover incentive payments1.5% penalty 2015; 2% penalty 2016Groups >100 must register PQRS to avoid additional 1% penalty
Eligible
for an additional +
1.0x - +2.0x if:
Reporting criteria are met
Scores are in the top 25th percentileExample: IF payment adjustment factor (x) is 0.75%: High quality/low cost groups of physicians could receive a 1.5% (2 x 0.75) upward payment adjustment 31
Slide32Synergies Exist Between All Hospital and Physician Domains32
Medicare Spending per Beneficiary
Cost Composite Score
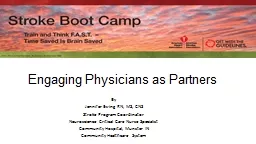
Slide33Key Approaches to Engaging PhysiciansPosition physician champions to lead clinical initiatives by…Clinical leadership and accountability
Oversight and initiative direction
Allowing for interpretation of quality and cost per case data
Determining key areas of focus for appropriate clinical resource utilization
Enhancing physician knowledge and skills
Slide34Role Of The Suppliers
Slide35How Can Suppliers Partner with Health Systems and Providers to Drive Quality?What products do suppliers have that can improve:Patient SafetyQuality of CareLength of StayReadmission
Hospital Acquired Conditions
Patient Satisfaction
What products do we have that may have secondary advantages to benefit hospitals under the ACA/VBP/HAC/Readmission Programs?
Slide36Supplier Innovations Support Quality ImprovementNutritional Support protocols have proven to reduce Length of StaySuppliers can add features to urinary catheter kits to make it easier for care givers to remove the catheters proven to reduce infectionCoronary Artery Bypass Graft surgical site infections could be reduced with easier to understand medication and dosing
Electronic Health Records software has been modified to simplify use of correct order sets and reminders to caregivers making the core measures easier to achieve 100% compliance
We need to capture the resources of our suppliers to improve quality
Supplier Resource Management - NOT just purchasing
Suppliers need to think in an innovative fashion and promote themselves in this arena –
we need to be asking them the questions!
Slide37Surgical Care Improvement Through Nutritional Optimization
Slide38Surgical ComplicationsSSI are #1 Hospital Acquired Condition1Infections are #1 cause of morbidity after surgery1Infections prolong hospital stays
2
Infections increase US healthcare costs by ~$10B annually
3
Surgical stress predisposes patients to immune dysfunction
5Increases risk of infectionMore so when malnourishedVarious nutrient and nutritional strategies have been studied to evaluate their effect on immune function & clinical outcomes (Drover, et al)
Slide39What Is Arginine?Amino acid involved in multiple metabolic processesPrecursor of polyamines and
hydroxyproline
10
C
onnective
tissue repairPrecursor of nitric oxide10Signaling moleculeEssential metabolic substrate for immune cells and required for normal lymphocyte function11Deficiency occurs after surgical stress11,12Mechanisms unknown Meta-analysis of RCTs evaluating perioperative arginine in elective surgical patients showed a statistically significant reduction in infectious complications and shorter LOSNo overall effect on mortality
Slide40Types of Elective Surgical Cases (RCTs)Upper GI MalignancyLower GI MalignancyPancreatic MalignancyOther Elective GI Surgery (Upper and Lower)Head & Neck MalignancyGYN Malignancy
Cardiac Surgery
Slide41Elective GI Malignancy SurgeryPatients with complications following surgery for GI Cancer
had
a
mean
additional hospital cost of $21,490 per stay vs. pateints without complicationsHaving postop complications increases readmission by a factor of 4.2xHaving postop complications increases LOS by 3-5 days
Slide42Nestlé IMPACT FormulaIMPACT formulas reduce the risk of infectious complications by 51% compared to standard nutritionOther immuno-nutrition formulas reduce the risk of infectious complications by 5% compared to standard nutrition
Slide43Nestlé IMPACT Formula – Complications ReviewedIMPACT formulas have been shown to reduce the risk of the following Hospital Acquired Conditions:
Slide44Nestlé IMPACT Formula – Complications Reviewed
Slide45Quick Glimpse of NE Hospital’s Bowel Resection Data
Reduce by 51%
Slide46Quick Glimpse of NE Hospital’s Cardiac Surgery Data Discharges from 4/1/2013 to 3/31/3014; 168 Total Cardiac Surgery Cases (shown above)
Reduce by 51%
Slide47Progress To DateApproval to move forward (planning & data mining) by
steering
committee
Live planning session at Nestlé Headquarters –
July 1-2,
Florham Park, NJDr. Sabharwal, MedAssetsDr. Schilling, MedAssetsDr. Ochoa, CMO Nestlé Health SciencesConcurrent further data reviewThomas Peterman, MedAssetsTodd Pelisse, MedAssetsProject Plan/Gantt Chart development with milestones and KPIsPresent back to steering committee (CFO, CMO, CMIO, VP Phys. Svc., Supply Chain/Materials Managment)Final approval received from steering committee for kick-off and Implementation
Slide48Progress To Date (cont.)Review Gantt chart and project milestonesFollow up live meeting in DenverFinalize Vendor/Supplier risk sharing agreementInitial cases of supply provided at no cost
Several other ways to invoke supplier risk
Outcomes based, etc.
Engage nutritionist(s)
Engage supply chain/materials management
Engage key GI surgeonsDr. Ochoa, CMO Nestlé; Live forum
Slide49Next StepsDevelop multi-disciplinary teamSupply Chain / Materials Management (Lead)Nutrition ServicesPre-Op Clinic
ICU Dietary
Physician Offices
External support via: Nestle & MedAssets
Education
TrainingLaunch nutrition protocolMonitor compliance, results and outcomesHold suppliers accountable for results
Slide50Gantt Chart
Slide51Medicare Spending per BeneficiarySynergies Exist Between All Hospital and Physician Quality Domains…Where Do Suppliers Fit In?
51
Cost Composite Score
Supplier
Risk Sharing
Slide52Slide53If you need an icon and its not shown here please contact Corporate Marketing.
Charts
Technology
Documents
People
MedicalBuildings
Slide54Arrows
Tools
Marks
Measure
Finance
If you need an icon and its not shown here please contact Corporate Marketing.
Slide55Communication
Maps
Misc
If you
need
an icon not shown here, please contact Corporate Marketing.