
Tx transplant pt yrs patient years Figure 7 1 Percentage of dialysis patients waitlisted and unadjusted kidney transplant rates 19962013 Vol 2 ESRD Ch 7 2 Data ID: 929444
Download Presentation The PPT/PDF document "Data Source: Reference Tables E4 and E9..." is the property of its rightful owner. Permission is granted to download and print the materials on this web site for personal, non-commercial use only, and to display it on your personal computer provided you do not modify the materials and that you retain all copyright notices contained in the materials. By downloading content from our website, you accept the terms of this agreement.


Slide1
Slide2Data Source: Reference Tables E4 and E9. Percentage of dialysis patients on the kidney waiting list is for all dialysis patients. Unadjusted transplant rates are for all dialysis patients. Abbreviations: Tx, transplant; pt yrs, patient years.
Figure 7.1 Percentage of dialysis patients wait-listed and unadjusted kidney transplant rates, 1996-2013
Vol 2, ESRD, Ch 7
2
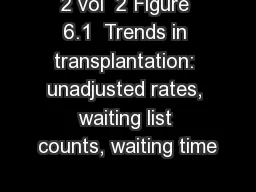
Slide3Data Source: Reference Tables E2 and E3. Waiting list counts include all candidates listed for a kidney transplant on December 31 of each year. Waiting time is calculated for all candidates enrolled on the waiting list in a given year. Figure 7.2 Number of patients wait-listed for kidney transplant, 1996-2013,
and waiting time, 1996-2010Vol 2, ESRD, Ch 7
3
Slide4Data Source: Reference Tables E8, E8(2), and E8(3). Counts of transplants are for all dialysis patients. Figure 7.3 Number of kidney transplants,
1996-2013Vol 2, ESRD, Ch 74
Slide5Data Source: Reference Table D9. Prevalent counts of patients with a functioning kidney transplant as of December 31 of each year. Figure 7.4
Number of patients with a functioning kidney transplant, 1996-2013Vol 2, ESRD, Ch 75
Slide6Data Source: Reference Table E5(2). Waiting list or transplantation among incident ESRD patients by age (0-74 years). Figure 7.5 Percentage of incident patients being wait-listed or
receiving a kidney transplant within one year of ESRD initiation, by age, 1996-2012Vol 2, ESRD, Ch 7
6
Slide7Data Source: Reference Table H6. Annual mortality rates of dialysis patients on the kidney transplant waiting list per 1,000 dialysis patient years at risk, by patient vintage. Abbreviation: pt yrs, patient years.
Figure 7.6 Annual mortality rates for dialysis patients on the kidney transplant waiting list by time on the list, 1996-2013
Vol 2, ESRD, Ch 7
7
Slide8Data Source: Reference Table E9. Table 7.1 Unadjusted kidney transplant rates, all donor types, by age, sex, race,
and primary cause of ESRD, per 100 dialysis patient years, 2004-2013Vol 2, ESRD, Ch 7
8
Age
2004
2005
2006
2007
2008
2009
2010
2011
2012
2013
0-21
31.2
34.9
35.4
30.3
30.9
33.3
31.5
30.5
31.2
30.4
22-44
11.6
11.2
10.8
10.1
9.2
9.3
8.7
8.3
8.2
7.9
45-64
6.1
6.0
6.0
5.6
5.3
5.1
5.0
4.8
4.4
4.5
65-74
2.3
2.6
2.7
2.5
2.6
2.6
2.6
2.6
2.5
2.5
75 and up
0.2
0.3
0.3
0.4
0.3
0.4
0.4
0.4
0.4
0.3
Sex
Male
5.6
5.6
5.6
5.1
4.9
4.7
4.5
4.3
4.1
4.0
Female
4.5
4.5
4.3
4.1
3.8
3.9
3.7
3.5
3.3
3.3
Race
White
6.2
6.1
6.0
5.6
5.2
5.0
4.7
4.5
4.3
4.2
Black/African American
3.2
3.3
3.3
3.1
3.0
3.0
3.0
2.9
2.6
2.6
Native American
3.7
3.3
3.9
3.0
3.6
3.7
3.0
3.2
2.7
2.4
Asian
5.4
5.5
5.3
4.8
5.0
4.6
4.7
4.4
4.5
4.5
Primary Cause of ESRD
Diabetes
3.4
3.4
3.2
3.0
2.9
2.8
2.6
2.5
2.3
2.3
Hypertension
3.1
3.2
3.2
3.1
2.9
2.9
2.8
2.6
2.6
2.5
Glomerulonephritis
10.2
9.7
9.9
9
8.7
8.7
8.8
8.3
7.9
7.7
All
5.1
5.1
5.0
4.7
4.4
4.3
4.1
4.0
3.7
3.7
Slide9Data Source: Reference Table E8(2). Deceased donor kidney transplant counts by recipient age. Figure 7.7 Number of deceased donor transplants and unadjusted transplant rates
among deceased donor kidney recipients, by recipient age, 1996-2013Vol 2, ESRD, Ch 7
9
(a)
Number
of transplants by age
Slide10Data Source: Reference Table E9(2). Unadjusted deceased donor kidney transplant rates by recipient age. Abbreviation: pt, patient.Vol 2, ESRD, Ch 7
10
Figure
7.7 Number of deceased donor transplants and unadjusted transplant rates
among
deceased donor kidney recipients, by recipient age,
1996-2013
(b) Transplant
rates by
age
Slide11Data Source: Reference Table E8(2). Deceased donor kidney transplant counts by recipient sex. Figure 7.8 Number of deceased donor transplants and unadjusted transplant rates among deceased donor kidney recipients, by recipient sex,
1996-2013Vol 2, ESRD, Ch 711
(a)
Number
of transplants by
sex
Slide12Data Source: Reference Table E9(2). Unadjusted deceased donor kidney transplant rates by recipient sex. Abbreviation: pt yrs, patient years.Vol 2, ESRD, Ch
712
Figure 7.8 Number of deceased donor transplants and unadjusted transplant rates
among
deceased donor kidney recipients, by recipient sex,
1996-2013
(b)
Transplant
rates by
sex
Slide13Data Source: Reference Table E8(2). Deceased donor kidney transplant counts by recipient race. Abbreviations: Blk/Af Am, Black/African American; Native Am, Native American. Figure 7.9 Number of deceased donor transplants and
unadjusted transplant rates among deceased donor kidney recipients, by recipient race, 1996-2013Vol 2, ESRD, Ch
713
(a)
Number
of transplants by
race
Slide14Data Source: Reference Table E9(2). Unadjusted deceased donor kidney transplant rates by recipient race. Abbreviations: Blk/Af Am, Black/African American; Native Am, Native American; pt, patient.
Vol 2, ESRD, Ch 714
Figure 7.9 Number of deceased donor transplants and
unadjusted
transplant rates
among
deceased donor kidney recipients, by recipient race,
1996-2013
(b)
Transplant rates by race
Slide15Data Source: Reference Table E8(2). Deceased donor kidney transplant counts by recipient primary cause of ESRD. Abbreviations: DM, diabetes mellitus; ESRD, end-stage renal disease; GN, glomerulonephritis; HTN, hypertension. Figure 7.10 Number of deceased donor transplants and unadjusted transplant rates among deceased donor kidney recipients, by recipient primary cause of ESRD,
1996-2013 Vol 2, ESRD, Ch 715
(a)
Number
of transplants by primary cause of
ESRD
Slide16Data Source: Reference Table E9(2). Unadjusted deceased donor kidney transplant rates by recipient primary cause of ESRD. Abbreviations: DM, diabetes mellitus; ESRD, end-stage renal disease; GN, glomerulonephritis; HTN, hypertension; pt, patient.Vol 2, ESRD, Ch
716
(b)
Transplant rates by primary cause of
ESRD
Figure
7.10 Number
of deceased donor transplants and unadjusted transplant rates among deceased donor kidney recipients, by recipient primary cause of ESRD,
1996-2013
Slide17Data Source: Reference Table E8(3). Living donor kidney transplant counts by recipient age. Figure 7.11 Number of living donor transplants and unadjusted transplant rates among
living donor kidney recipients, by recipient age, 1996-2013Vol 2, ESRD, Ch 717
(a)
Number
of transplants by
age
Slide18Data Source: Reference Table E9(3). Unadjusted living donor kidney transplant rates by recipient age. Abbreviation: pt, patient.Vol 2, ESRD, Ch 7
18
Figure 7.11 Number of living donor transplants and unadjusted transplant rates
among living donor kidney recipients, by recipient age,
1996-2013
(b)
Transplant rates
by
age
Slide19Data Source: Reference Table E8(3). Living donor kidney transplant counts by recipient sex.Vol 2, ESRD, Ch 7
19
Figure 7.12 Number of living donor transplants and unadjusted transplant rates
among living donor kidney recipients, by recipient
sex, 1996-2013
(a)
Number
of transplants by
sex
Slide20Data Source: Reference Table E9(3). Unadjusted living donor kidney transplant rates by recipient sex. Abbreviation: pt yrs, patient years.Vol 2, ESRD, Ch
720
Figure
7.12 Number of living donor transplants and unadjusted transplant rates
among
living donor kidney recipients, by recipient
sex, 1996-2013
(b)
Transplant rates
by
sex
Slide21Data Source: Reference Table E8(3). Living donor kidney transplant counts by recipient race. Abbreviations: Blk/Af Am, Black/African American; Native Am, Native American. Vol 2, ESRD, Ch 7
21
Figure
7.13 Number of living donor transplants and unadjusted transplant rates
among
living donor kidney recipients, by recipient
race, 1996-2013
(a)
Number
of transplants by
race
Slide22Data Source: Reference Table E9(3). Unadjusted living donor kidney transplant rates by recipient race. Abbreviations: Blk/Af Am, Black/African American; Native Am, Native American; pt, patient.
Vol 2, ESRD, Ch 722
Figure
7.13
Number of living donor transplants and unadjusted transplant rates
among
living donor kidney recipients, by recipient
race, 1996-2013
(b)
Transplant rates
by
race
Slide23Data Source: Reference Table E8(3). Living donor kidney transplant counts by recipient primary cause of ESRD. Abbreviations: DM, diabetes mellitus; ESRD, end-stage renal disease; GN, glomerulonephritis; HTN, hypertension.Vol 2, ESRD, Ch 7
23
Figure 7.14
Number of living donor transplants and unadjusted transplant rates among
living donor kidney recipients, by recipient primary cause of ESRD,
1996-2013
(a)
Number
of transplants by primary cause of ESRD
Slide24Data Source: Reference Table E9(3). Unadjusted living donor kidney transplant rates by recipient primary cause of ESRD. Abbreviations: DM, diabetes mellitus; ESRD, end-stage renal disease; GN, glomerulonephritis; HTN, hypertension; pt, patient. Vol 2, ESRD, Ch 7
24
Figure
7.14 Number of living donor transplants and unadjusted transplant rates
among
living donor kidney recipients, by recipient primary cause of ESRD,
1996-2013
(b)
Transplant rates by
primary cause of ESRD
Slide25Data Source: Data on the annual number of deaths in the US population are obtained from the Centers for Disease Control and Prevention; the deceased donor data are obtained from UNOS. Deceased donor kidney donation rates by donor age. Figure 7.15 Number of deceased kidney donors and unadjusted kidney donation rates,
by donor age, 1999-2013Vol 2, ESRD, Ch 7
25
(a)
Number
of
donors by age
Slide26Vol 2, ESRD, Ch 726
Figure 7.15 Number of deceased kidney donors and unadjusted kidney donation rates,
by donor age, 1999-2013
(b)
Donation rates by age
Data Source: Data on the annual number of deaths in the US population are obtained from the Centers for Disease Control and Prevention; the deceased donor data are obtained from UNOS. Deceased donor kidney donation rates by donor age.
Slide27Data Source: Data on the annual number of deaths in the US population are obtained from the Centers for Disease Control and Prevention; the deceased donor data are obtained from UNOS. Deceased donor kidney donation rates by donor sex. Vol 2, ESRD, Ch 7
27
Figure 7.16 Number
of deceased kidney donors and unadjusted kidney donation rates, by donor
sex, 1999-2013
(a)
Number
of
donors by sex
Slide28Vol 2, ESRD, Ch 728
Figure 7.16 Number of deceased kidney donors and unadjusted kidney donation rates,
by donor sex, 1999-2013
(b)
Donation rates by sex
Data Source: Data on the annual number of deaths in the US population are obtained from the Centers for Disease Control and Prevention; the deceased donor data are obtained from UNOS. Deceased donor kidney donation rates by donor sex.
Slide29Data Source: The US death population data are obtained from the Centers for Disease Control and Prevention; the deceased donor data are obtained from UNOS. Deceased donor kidney donation rates by donor race. Abbreviations: Asian/Pac, Asian/Pacific Islander; Blk/Af Am, Black/African American; Native Am, Native American.
Vol 2, ESRD, Ch 729
Figure
7.17 Number
of deceased kidney donors and unadjusted kidney donation rates,
by
donor
race, 1999-2013
(a)
Number
of
donors by race
Slide30Vol 2, ESRD, Ch 730
Figure 7.17 Number of deceased kidney donors and unadjusted kidney donation rates,
by donor race, 1999-2013
(b)
Donation
rates by race
Data Source: The US death population data are obtained from the Centers for Disease Control and Prevention; the deceased donor data are obtained from UNOS. Deceased donor kidney donation rates by donor race. Abbreviations: Asian/Pac, Asian/Pacific Islander;
Blk
/
Af
Am, Black/African American; Native Am, Native
American.
Slide31Data Source: Reference Tables F2, F14, I26; F5, F17, I29; F6, F18, I30. Outcomes among recipients of a first-time deceased donor kidney transplant; unadjusted. Abbreviations: Prob., probability. Table 7.2 Trend
in 1-, 5-, & 10-year deceased donor kidney transplant outcomes, 1996-2012Vol 2, ESRD, Ch 7
31
One year post-transplant
Five years post-transplant
Ten years post-transplant
Year
Prob. of all-cause graft failure
Prob. of return to dialysis or repeat transplant
Prob. of death
Prob. of all-cause graft failure
Prob. of return to dialysis or repeat transplant
Prob. of death
Prob. of all-cause graft failure
Prob. of return to dialysis or repeat transplant
Prob. of death
1996
14.3%
10.2%
5.8%
36.2%
25.7%
19.4%
59.1%
42.9%
39.3%
1997
12.9%
8.5%
6.2%
34.7%
23.7%
19.2%
58.1%
40.8%
39.6%
1998
12.8%
9.2%
5.5%
33.8%
24.0%
18.1%
56.8%
40.4%
38.1%
1999
13.7%
9.2%
5.9%
34.0%
23.1%
18.9%
56.8%
39.4%
38.4%
2000
13.2%
8.6%
6.4%
34.6%
23.1%
19.7%
57.3%
39.1%
39.3%
2001
12.2%
8.0%
5.7%
33.3%
21.4%
19.9%
55.8%
37.0%
38.7%
2002
12.3%
8.3%
5.8%
33.0%
22.2%
18.9%
54.1%
36.2%
37.4%
2003
12.1%
7.6%
5.7%
32.1%
20.6%
18.6%
54.9%
36.1%
37.9%
2004
11.5%
7.3%
5.5%
31.7%
20.8%
18.4%
2005
11.4%
7.1%
6.0%
30.2%
19.3%
18.0%
2006
10.8%
7.0%
5.2%
29.6%
18.9%
17.3%
2007
9.7%
6.2%
4.7%
28.5%
17.9%
16.9%
2008
9.5%
6.2%
4.4%
26.9%
16.2%
16.3%
2009
9.5%
5.7%
5.0%
2010
9.0%
5.6%
4.5%
2011
7.6%
4.6%
3.9%
2012
7.6%
4.6%
3.8%
Slide32Data Source: Reference Tables F8, F20, I32; F11, F23, I35; F12, F24, I36. Outcomes among recipients of a first-time living donor kidney transplant; unadjusted. Abbreviations: Prob., probability. Table 7.3 Trend
in 1-, 5-, & 10-year living donor kidney transplant outcomes, 1996-2012Vol 2, ESRD, Ch 7
32
One year post-transplant
Five years post-transplant
Ten years post-transplant
Year
Prob. of all-cause graft failure
Prob. of return to dialysis or repeat transplant
Prob. of death
Prob. of all-cause graft failure
Prob. of return to dialysis or repeat transplant
Prob. of death
Prob. of all-cause graft failure
Prob. of return to dialysis or repeat transplant
Prob. of death
1996
6.9%
5.2%
2.3%
22.9%
16.8%
9.6%
43.3%
32.4%
22.7%
1997
6.7%
4.8%
2.7%
22.2%
15.8%
10.5%
43.2%
31.1%
24.4%
1998
6.0%
4.4%
2.3%
20.9%
14.6%
10.0%
42.4%
30.6%
23.4%
1999
6.1%
4.3%
2.2%
20.8%
14.7%
9.6%
41.2%
29.0%
22.7%
2000
6.6%
4.6%
2.6%
21.9%
14.9%
10.6%
42.2%
29.1%
24.0%
2001
6.2%
4.1%
2.5%
21.3%
14.3%
10.2%
41.2%
27.8%
24.0%
2002
5.8%
3.9%
2.5%
20.5%
13.6%
10.3%
40.0%
26.2%
24.6%
2003
5.4%
3.9%
1.9%
20.1%
13.8%
9.5%
39.6%
26.1%
23.3%
2004
5.2%
3.5%
2.1%
18.8%
12.7%
8.8%
2005
5.3%
3.7%
2.0%
18.7%
12.6%
8.8%
2006
4.4%
3.0%
1.7%
16.8%
11.1%
8.1%
2007
3.8%
2.4%
1.4%
16.6%
10.5%
8.0%
2008
4.1%
2.7%
1.6%
15.3%
9.9%
7.5%
2009
3.9%
2.6%
1.4%
2010
3.5%
2.2%
1.4%
2011
3.4%
2.2%
1.9%
2012
3.2%
1.9%
1.5%
Slide33Data Source: Special analyses, USRDS ESRD Database. Acute rejection rates during the first year post-transplant for recipients age 18 and older with a functioning graft at discharge. Figure 7.18 Acute rejection within the first year post-transplant for
kidney transplant recipients, 1996-2013Vol 2, ESRD, Ch 7
33