
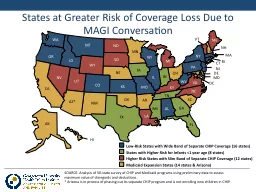
simonandrewsbabrahamacuk simonandrews v202202 What this course covers The theory of ChIPSeq ChIPSeq library properties Sequencing Data processing and QC Data visualisation and exploration ID: 930678
Download Presentation The PPT/PDF document "ChIP-Seq Analysis Simon Andrews" is the property of its rightful owner. Permission is granted to download and print the materials on this web site for personal, non-commercial use only, and to display it on your personal computer provided you do not modify the materials and that you retain all copyright notices contained in the materials. By downloading content from our website, you accept the terms of this agreement.


Slide1
ChIP-Seq Analysis
Simon Andrewssimon.andrews@babraham.ac.uk@simon_andrewsv2022-02
Slide2What this course covers
The theory of ChIP-SeqChIP-Seq library propertiesSequencing, Data processing and QCData visualisation and explorationTypes of analysisPeak Calling
Differential Binding
Slide3What is ChIP-Seq?
ChIP-Seq is a technology which uses high-throughput sequencing to infer the positions of any mark associated with DNA which can be captured by an antibody.
Slide4Types of antibody
Transcription factors / repressors nanog, CTCF
Histones and histone modifications
H3, H3K4me3
DNA modifications
Methyl-Cytosine, Formyl cytosine
Chromatin remodelling proteins
BMI1, EZH2
Transcription machinery
Pol2
Slide5How Does ChIP-Seq work
DNA
DNA
Cross-link proteins to DNA
Fragment DNA (sonication,
MNase
etc
)
Y
Y
Y
Y
Y
Y
Y
Y
Capture
Elute
Remove Crosslinks
Size Select
Add Adapters
Sequence
Slide6Related Techniques
ATAC-SeqUses transposases to digest exposed DNA to enrich for accessible DNA.Cut and RunUses transposes fused to antibodies to find marked, accessible chromatin
DamID
/
DamIP
Fuses a
methyltransferase
to a protein then measures methyl-Adenine by bisulphite
seq
(
DamID
) or mA
ChIP
(
DamIP)
Slide7What can you sequence?
Input Material (sonicated /
Mnase
/ H3
etc
)
ChIP
Material
Y
Y
Y
Y
Y
Y
Y
Y
Mock (IgG)
ChIP
Material
Y
Y
Y
Y
Y
Y
Y
Y
Slide8Sequencing for ChIP
ChIP
Fragment
Adapter
Barcode
Adapter
Barcode
ChIP
Fragment
Adapter
Primer
Read 1
ChIP
Fragment
Adapter
Primer
Read 2
Barcode Read
Slide9What you end up with
Slide10Single End vs Paired End
Insert
Inferred
Read 1
Read 2
Paired
(= >$£€¥)
Inferred
Read 1
Single
(= Cheaper!)
Slide11What you end up with
Original
40bp
Reads
Extended
by
250bp
Slide12Types of Enrichment
Single points (typical TF, some histone marks)
Slide13Types of Enrichment
Broad Regions (some histone marks, PolII)
Slide14Types of Enrichment
Virtually everywhere (h3)
Slide15Types of Enrichment
Artefactual (GC in this case)
Slide16What are you actually measuring?
ChIP Seq measures RELATIVE enrichmentRegion A has twice as much signal as Region BWithout some external calibration,
NOTHING
in
ChIP-Seq
gives an
ABSOLUTE
measure.
Slide17What can affect enrichment?
Starting
More Sites
Poorer Signal
Slide18What sort of questions can you answer?
Where is this mark present?General - it's in promoters, gene bodies etc.Specific - it's at these lociHow does this mark change when I do XXX?Categorical: A peak disappears
Quantitative: The enrichment of a locus changes
Slide19ChIP-Seq Data
Processing and QC
Slide20A typical ChIP Library
Potential technical problemsAdapter contaminationPCR DuplicationPotential biological problemsLack of enrichment
Other selection biases
ChIP
Fragment
Adapter
Barcode
Adapter
Barcode
Slide21QC of raw sequenceBase Call Quality
Slide22QC of raw sequenceSequence Composition
Slide23QC of raw sequenceSequence Composition
Slide24QC of raw sequence
Adapter Contamination
ChIP
Fragment
Adapter
Barcode
Adapter
Barcode
Read
Trim Galore!
Quality and Adapter Trimming
Slide25Mapping ChIP Data
All regions should be linear genomic stretchesStandard genomic aligners are fineBowtie2 http://bowtie-bio.sourceforge.net/bowtie2/BWA http://bio-bwa.sourceforge.net/
Slide26Example Bowtie2 Mapping
Create Genome Index (once - slow!)Map a single FastQ file
bowtie2-build
yeast_genome.fa
yeast_index
bowtie2 \
-x
yeast_index
\
-U data.fastq.gz \
|
samtools
view
\
-
bS
\
-o
data.bam
Slide27Post Alignment QCMapping Statistics
41523294 reads; of these: 41523294 (100.00%) were unpaired; of these:
1851792 (4.46%) aligned 0 times
32175322 (77.49%) aligned exactly 1 time
7496180 (18.05%) aligned >1 times
95.54% overall alignment rate
Slide28Post Alignment ProcessingMAPQ Filtering
ChIP-Seq relates sequences to positions in a reference genomeYou need to be confident that the reported position is correctFiltering on MAPQ value (likelihood of reported position being incorrect) is an easy way to do this
MAPQ filtering should be performed in most cases
samtools
view -q 20 -b -o
filtered.bam
data.bam
Slide29To Deduplicate or Not?
Deduplication can make enrichment visually clearer and help to spot truly enriched regionsDeduplication alters quantitation
Slide30Assessing Duplication
Read Density
Observed Duplication (%)
Read Density
Observed Duplication (%)
Slide31Performing Deduplication
Only deduplicate ifYou can see that you have technical duplication in your dataYou only care about identifying enriched regions (peaks)You don’t need quantitative enrichment values for your peaks
java -jar picard.jar
MarkDuplicates
\
INPUT=
sorted.bam
\
OUTPUT=
dedup.bam
\
METRICS_FILE=metrics.txt
java -jar picard.jar
SortSam
\
INPUT=
filtered.bam
\
OUTPUT=
sorted.bam
\
SORT_ORDER=coordinateDO NOT DEDUPLICATE AS A MATTER OF COURSE! THINK FIRST!
Slide32MultiQC
Report
Standard Processing Workflow
Mapping Stats
Mapping Stats
Mapping Stats
FastQ
File
FastQ
File
FastQ
File
FastQC
Report
FastQC
Report
FastQC
Report
Trimmed FQ File
Trimmed FQ File
Trimmed FQ File
FastQC
Report
FastQC
Report
FastQC
Report
BAM File
BAM File
BAM File
Filtered BAM
Filtered BAM
Filtered BAM
Visualisation and Assessment
FastQC
FastQC
Trim
Galore
Bowtie
BWA
SAM
Tools
Slide33Running programs in Linux
Open a shell (text based OS interface)Type the name of the program you want to runAdd on any options the program needsPress return - the program will runWhen the program ends control will return to the shellRun the next program!
Slide34Running programs
babraham@babraham-VirtualBox:~$
ls
Desktop Documents Downloads
examples.desktop
Music Pictures Public Templates Videos
babraham@babraham-VirtualBox
:~$
Command prompt - you can't enter a command unless you can see this
The command we're going to run (
ls
in this case, to list files)
The output of the command - just text in this case
Slide35The structure of a unix command
ls
-
ltd
--reverse
Downloads
/ Desktop/ Documents/
Program
name
Switches
Data
(normally files)
Each option or section is separated by spaces. Options or files with spaces in must be put in quotes.
Slide36Command line switches
Change the behaviour of the programCome in two flavours (each option usually has both types available)Minus plus single letter (eg -x -c -z)
Can be combined (
eg
-
xcz
)
Two minuses plus a word (
eg
--extract --
gzip
)
Can't be combined
Some take an additional value, this can be an additional option, or use an = to separate (it's up to the program)-f somfile.txt (specify a filename)--width=30
(specify a value)
Slide37Specifying file paths
Absolute or Relative paths from whichever directory you are currently in/home/simon/Documents/Data/big_data.fq.gzMove to the directory with the data and just use file names
cd Data
big_data.fq.gz
Slide38Command line completion
Most errors in commands are typing errors in either program names or file pathsShells (ie BASH) can help with this by offering to complete path names for youCommand line completion is achieved by typing a partial path and then pressing the TAB key (to the left of Q)
Slide39Command line completion
Actual files in a folder:DesktopDocuments
Downloads
examples.desktop
Music
Pictures
Public
Templates
Videos
If I type the following and press tab:
De
[TAB] will complete to
Desktop
as it is the only option
T
[TAB] will complete to
Templates
as it is the only option
Do
[TAB] will no nothing (just beep) as it is ambiguous Do [TAB] [TAB] will show
Documents and Downloads since those are the only options
Do [TAB] [TAB] c [TAB] will complete to Documents
You should ALWAYS use TAB completion to fill in paths for locations which exist so you can't make typing mistakes(it obviously won't work for output files though)
Slide40Debugging Tips
If anything (except the splice site extraction) completes almost immediately then it didn't work!Look for errors before asking for help. They will either beThe last piece of text before the program exitedThe first piece of text produced after it started (followed by the help file)To see if a program is running go to another shell and look at the last file produced to see if it's growing
Programs which are stuck can be cancelled with
Control+C
Slide41Some useful commands
cd mydir Change directory to
mydir
ls -
ltrh
List files in the current directory, show details and put the newest files at the bottom
less x.txt
View the
x.txt
text file
Return = down one line
Space = down one page
q = quit
Slide42Data Processing Exercise
Slide43Exploring and Understanding ChIP-Seq
data
Slide44Some Basic Questions
Is there any enrichment?What is the size / patterning of enrichment?How well are my controls behaving?What is the best way to quantitate this data?Are there any technical artefacts?
Slide45Start with a visual inspection
Is there any enrichment?
What is the size / patterning of enrichment?
How well are my controls behaving?
Slide46Start with a visual inspection
Is there any enrichment?
What is the size / patterning of enrichment?
How well are my controls behaving?
Slide47Extending reads if necessary
Peak Width
For point enrichment, insert size is roughly peak width/2
Slide48Look for peaksAssociate with features
TSS
TSS
TSS
TSS
TSS
Are my peaks narrow or broad
Do peak positions obviously correspond to existing features?
Slide49Examine Controls
IgG or other Mock IPGood result is no material at allNot worth sequencing. Reads are only informative if the ChIP hasn't worked.May be justified for Cut and Run where there is no real input
Input material (sonicated /
Mnase
etc
)
Genomic library - everywhere equally
Technical issues can cause variation
Slide50Examine Controls
Does the coverage look evenIf there are multiple inputs to do they look similar
Slide51Examine Controls
Slide52Why do controls misbehave?
Low coverageRepetitive unmappable regionsHoles in the assemblyHigh coverageMismapped
reads from outside the assembly
Biases
GC content
Segmental Duplication
Blacklist these regions and remove them from the analysis (ignore hits within these regions)
Input normalisation might help, but requires further examination
Slide53Making Blacklists
Unusual CoverageOutlier detection (boxplots etc.)
Often only filter over-representation (maybe also zero counts)
Pre-built lists
Large projects often build these
ENCODE /
ModENCODE
UCSC
Not for all species
https://sites.google.com/site/anshulkundaje/projects/blacklists
Slide54Comparison of samples
Slide55Initial Quantitation
Always start with a simple unbiased quantitation (not focussed on features/peaks)Tiled measures over the whole genomeUse approximate insert size as window sizeSomething around 500bp is normally sensibleLinear read count quantitation corrected for total library size
Slide56Compare samplesVisual comparison against raw data
Similar apparent overall enrichment
Any obvious differences?
Slide57Compare samplesScatterplot input vs ChIP
Raw
Filtered
Slide58Compare samplesScatterplot input vs input
Any suggestion of differential biases in inputs
Can we merge them to use as a common input
Chr
8
Chr
11
Chr
Y
Slide59Compare samplesScatterplot
ChIP vs ChIP
Look at examples for different parts of the plot
Look for outgroups (differentially enriched)
Compare level of enrichment (compare to diagonal)
Slide60Compare samplesSummarise distributions
QQPlotPercentile though measures(x) vs Percentile through total quantitation (y)Perfect input is on the diagonal
More enrichment moves the curve down and right
How flat is your input? How consistent are the
ChIPs
?
Slide61Compare samples
Higher level clustering
Correlation Matrix
Correlation Tree
tSNE
Plot
PCA Plot
Slide62Associate enrichment with features
Slide63Trend Plots
Graphical way to look at overall enrichment relative to positions in featuresGene bodiesPromotersCpG islandsMay influence how we later quantitate and analyse the dataAnalyse per featureLook for exceptions to the general rule
Slide64Trend Plot Example
Overall average
Says nothing about the number / proportion of features affected
Slide65Check apparent trends against the data
TSS
Slide66Aligned Probes Plots give more detail
Information per feature instance
Comparison of equivalent features in different marks/samples
Slide67After exploration you should...
Know whether your ChIP is really enrichedKnow the nature / shape of the enrichmentKnow whether your controls behave wellKnow whether you're likely to have differential enrichmentKnow if you will need additional normalisationKnow the best strategy to measure your data
Slide68Data Exploration Exercise
Slide69Analysing ChIP-Seq
Data
Slide70Steps in Analysis
Define enriched regionsBased around featuresDe-novo peak predictionQuantitateCorrections and Normalisation
Compare
Categorical
Quantitative
Slide71Defining Regions - Should I peak call?
ChoicesMake measurements around features (promoters / genes / CpG islands etc)Make measurements around enriched regions (peaks)
Can I use features?
Do you see a strong and complete linkage between enrichment and the type of feature you want to use?
If not, then you should peak call
Slide72How MACS Works
Optimise the starting data
Build a background model
Test sliding windows
Apply per-site adjustment
Report
macs2
callpeak
--broad
-t
chip.bam
-c
input.bam
Slide73Optimise the starting data
Correct the for/rev offsetDeduplicate
Slide74Build a background model
Observed
Lambda value
Slide75Build a background model
Lambda value
Model
Critical p-value (n=18)
Slide76Build a background model
Lambda value
Observed + Model
Critical p-value (n=18)
Slide77Test Sliding Windows
Generally use half of the library fragment sizeWindows whose count exceeds the critical value are keptMerge adjacent windows over the critical value to form peaksGenerates candidate (not final) peak set
Slide78Correct for local variation
Critical value
Generate localised model if input density
is higher than the global value
Most pessimistic p-value is kept
Slide79Broad Peaks
Added in MACS2 – suitable where larger regions with variable enrichment existUses two thresholds for enrichment
Slide80How should you apply peak callers
Multiple ChIPs (over multiple conditions)Multiple Inputs
Slide81Multiple Inputs
Input variability is generally consistentMapabilityGenome AssemblyFragmentation biases
Unless you see substantial variability between inputs it’s better to combine them into a single reference input sample
Slide82Multiple ChIPs
WT
ChIP
1
WT
ChIP
2
KO
ChIP
1
KO
ChIP
2
BAM Files
Peak Sets
WT
ChIP
1
+
WT
ChIP 2+KO ChIP 1+KO ChIP 2
Peaks
WT ChIP 1+WT ChIP 2+KO
ChIP 1+KO ChIP 2
Slide83Multiple ChIPs
WT
ChIP
1
WT
ChIP
2
KO
ChIP
1
KO
ChIP
2
BAM Files
WT Peaks 1
WT Peaks 2
KO Peaks 1
KO Peaks 2
Peak Sets
WT Peaks 1
And
WT Peaks 2
KO Peaks 1
And
KO Peaks 2
WT Peaks 1
AndWT Peaks 2OrKO Peaks 1
AndKO Peaks 2
Slide84Why isn't a peak called
Fewer peaks are called by just sub-sampling the same data
Slide85Why isn't a peak called
With no input the region around the peak is used to model the background. Broader peaks can be missed
For ATAC data (no input) you should skip the rescoring step
(
--
nomodel
)
Slide86Reporting on Peak sets
Don’t make claims based solely on the number of peaks (“there were more WT peaks than KO peaks” for example)Don’t make claims based on regions being peaks in 1 set but not another (there were 465 peaks which were specific to KO)It is OK to make statements about overlap (there were 794 peaks which were common to WT and KO)You have to address differential enrichment problems quantitatively
Slide87Quantitating ChIP data for analysis
Quantitation of ChIP is not a simple problemCan start with something simple but in many cases you will need to refine this
Globally corrected log counts are a good place to start
Slide88Should I normalise to input?
Only consider input normalisation if:You have substantial variation in the coverage of your input (excluding outliers)Your
ChIP
signal is correlated with the input level
Slide89Why not just always do "fold over input"?
Inputs are generally poorly measuredPoor coverage compared to ChIPFold change values are more influenced by input than ChIP
Biases in the input are smaller than enrichment power of the antibody
Region
Input
ChIP
ChIP
/Input
Region A
5
200
40
Region B
2
200
100
Slide90Hits with increased enrichment
Hits with decreased enrichment
Slide91Evaluating and Normalising Enrichment
Good EnrichmentWorse Enrichment
Similar Enrichment
Small Difference
Large Difference
Slide92Evaluating and Normalising Enrichment
Normalised Read Count
Percentile through data
Slide93Normalising Enrichment
Size FactorSingle point of comparisonWorks well for small differencesInsufficient for large differencesAllows the use of count based stats
Small Difference
Large Difference
Large Difference
Small Difference
Quantile
Forces distributions to be identical
Corrects any differences, easy to apply
Enrichment
Two points of comparison
Corrects for larger differences
Not directly compatible with count based stats
Slide94Normalising Enrichment
Slide95Checking Normalisation
Before Normalisation
After Normalisation
Slide96Look for systematic enrichment changes (real biology!!)
Use replicates to build a case for a biological rather than technical difference
Slide97Differential enrichment analysis
Needs to be quantitativeNeeds to operate on non-deduplicated dataTwo statistical optionsCount based stats on raw uncorrected countsDESeqEdgeR
Continuous quantitation stats on normalised enrichment values
LIMMA
Slide98Which statistic to pick?
If enrichment is roughly similarRaw counts, then DESeq/EdgeRIf there are large differences in enrichmentEnrichment normalisation
LIMMA statistics
Slide99Visualisation of hits
Map onto scatterplot for simple verificationNormally makes sense to use log transformed countsLook at the data underneath candidates you make specific claims about
Slide100Hit validation
Look whether hits make senseLook at points which change but were not selected
Log scale should be used
Keep the context of non-hits
Slide101Hit validationDirectionality
Most ChIP enrichments are not strand-specificShould expect to see enrichment on both strands
Slide102Hit validationHeatmap
You should be able to see consistency between replicates
Slide103Data Analysis Exercise
Slide104Experimental Design
Slide105Experimental Design Considerations
All normal rules applyThink about sources of variationDon't confound variablesThink about what batch effects might existTest your antibody well before startingBy far the biggest factor in success
Good performance on Western / in-situ is not a guarantee, but it's a good start
Slide106Experimental Design Considerations
Number of replicatesLots of studies use 2 replicatesFine for just finding binding sites (motif analysis)Not really enough for differential bindingHuge reliance on 'information sharing'No accurate measurement of variance per peak
Potentially over-predicts differential binding
Should think about likely levels of variability and make replicates to match
Slide107Experimental Design Considerations
Amount of sequencingCan be difficult to predictDepends onGenome sizeProportion of genome which is enrichedEfficiency of enrichmentENCODE standard is ~20M reads per sample
Can get away with fewer (K4me3 for example)
Will need more for some marks (H3 for example)
Sequencing depth will affect ability to detect changes
Slide108Experimental Design Considerations
Type of sequencingSingle end is fine for most applicationsATAC-Seq can require paired end for some analysesModerate read length is requiredCan map anywhere in the genome50bp is probably OK. 100bp would be preferable
Slide109Downstream Analyses
Slide110Composition / Motif Analysis
CompositionGood place to start, can provide either biological or technical insightSee if hits (up vs down) cluster based on the underlying sequence compositionMotifsGreat for defining putative binding sitesInteresting to do sensitivity checkCan do differential motif calling (for hit/non-hit)
Slide111Compter - composition analysis
www.bioinformatics.babraham.ac.uk/projects/compter
Slide112MEME - Motif Analysis
Slide113Gene Ontology / Pathway
Be careful how you relate hits to genesReally need to have a global link between peak positions and genesRandom positions will give significant GO hits if you just use closest/overlapping genes