
Battu MASS SPECTROMETRY Deptof Chemistry Avanthi Degree amp PG College Mass Spectrometry Introduction General overview Mass Spectrometry is the generation separation and characterization of gas phase ions according to their relative mass as a function of charge ID: 931028
Download Presentation The PPT/PDF document "Presented by Jaghdish" is the property of its rightful owner. Permission is granted to download and print the materials on this web site for personal, non-commercial use only, and to display it on your personal computer provided you do not modify the materials and that you retain all copyright notices contained in the materials. By downloading content from our website, you accept the terms of this agreement.


Slide1
Presented by Jaghdish Battu
MASS SPECTROMETRY
Dept.of
Chemistry
Avanthi Degree & P.G College
Slide2Mass SpectrometryIntroductionGeneral overviewMass Spectrometry is the generation, separation and characterization of gas phase ions according to their relative mass as a function of charge
Previously, the requirement was that the sample be able to be vaporized (similar limitation to GC), but modern ionization techniques allow the study of such non-volatile molecules as proteins and nucleotidesThe technique is a powerful qualitative and quantitative tool, routine analyses are performed down to the femtogram (10
-15
g) level and as low as the zeptomole (10
-21 mol) level for proteinsOf all the organic spectroscopic techniques, it is used by more divergent fields – metallurgy, molecular biology, semiconductors, geology, archaeology than any other
Slide3Mass SpectrometryI. The Mass SpectrometerGeneral SchematicA mass spectrometer needs to perform three functions:
Creation of ions – the sample molecules are subjected to a high energy beam of electrons, converting some of them to ions
Separation of ions
– as they are accelerated in an electric field, the ions are separated according to mass-to-charge ratio (m/z)
Detection of ions
– as each separated population of ions is generated, the spectrometer needs to qualify and quantify them
The differences in mass spectrometer types are in the different means to carry out these three functions
Common to all is the need for very high vacuum (~ 10
-6
torr
), while still allowing the introduction of the sample
Slide4Mass SpectrometryThe Mass SpectrometerSingle Focusing Mass SpectrometerA small quantity of sample is injected and vaporized under high vacuum
The sample is then bombarded with electrons having 25-80 eV
of energy
A valence electron is
“punched” off of the molecule, and an ion is formed
Slide5Mass SpectrometryThe Mass SpectrometerThe Single Focusing Mass Spectrometer
Ions (+) are accelerated using a (-) anode towards the focusing magnet
At a given potential (1 – 10 kV) each ion will have a kinetic energy:
½ mv
2
=
eV
As the ions enter a magnetic field, their path is curved; the radius of the curvature is given by:
r =
mv
eH
If the two equations are combined to factor out velocity: m/e = H2r2 2V
m = mass of ion
v = velocity
V = potential difference
e = charge on ion
H
= strength of magnetic field
r = radius of ion path
Slide6Mass SpectrometryThe Mass SpectrometerSingle Focusing Mass Spectrometer
At a given potential, only one mass would have the correct radius path to pass through the magnet towards the detector
“
Incorrect
” mass particles would strike the magnet
Slide7Mass SpectrometryThe Mass SpectrometerSingle Focusing Mass SpectrometerBy varying the applied potential difference that accelerates each ion, different masses can be discerned by the focusing magnet
The detector is basically a counter, that produces a current proportional to the number of ions that strike it
This data is sent to a computer interface for graphical analysis of the mass spectrum
Slide8Mass SpectrometryII. The Mass SpectrumA. Determination of Molecular Mass
When a M+ peak is observed it gives the molecular mass – assuming that every atom is in its most abundant isotopic form
Remember that carbon is a mixture of 98.9%
12
C (mass 12), 1.1% 13C (mass 13) and <0.1% 14C (mass 14)
We look at a periodic table and see the atomic weight of carbon as 12.011 – an average molecular weight
The mass spectrometer, by its very nature would see a peak at mass 12 for atomic carbon and a M + 1 peak at 13 that would be 1.1% as high
Slide9Mass SpectrometryThe Mass SpectrumDetermination of Molecular Mass Some molecules are highly fragile and M+ peaks are not observed – one method used to confirm the presence of a proper M+ peak is to lower the ionizing voltage – lower energy ions do not fragment as readily
Three
facts must apply for a molecular ion peak:
The peak must correspond to the highest mass ion on the spectrum excluding the isotopic peaks
The ion must have an odd number of electrons – usually a radical
cation
The
ion must be able to form the other fragments on the spectrum by loss of logical neutral fragments
Slide10Mass SpectrometryII. The Mass SpectrumDetermination of Molecular Mass
The Nitrogen Rule is another means of confirming the observance of a molecular ion peak
If a molecule contains an even number of nitrogen atoms (only
“
common” organic atom with an odd valence) or no nitrogen atoms the molecular ion will have an even mass value
If a molecule contains an odd number of nitrogen atoms, the molecular ion will have an odd mass value
If the molecule contains chlorine or bromine, each with two common isotopes, the determination of M+ can be made much easier, or much more complex as we will see
Slide11Mass Spectrometry III. The Mass Spectrum and Structural Analysis
Inferences from Isotopic Ratios For molecules that contain Cl
or Br, the isotopic peaks
are
diagnosticIn both cases the M+2 isotope is prevalent:35Cl is 75.77% and 37Cl is 24.23% of naturally occurring chlorine atoms
79
Br is 50.52% and
81
Br is 49.48% of naturally occurring bromine atoms
If a molecule contains a single chlorine atom, the molecular ion would appear:
m/e
relative abundance
M
+
M+2
The M+2 peak would be 24% the size of the M
+
if one Cl is present
Slide12Mass Spectrometry The Mass Spectrum and Structural AnalysisInferences from Isotopic Ratios For molecules that contain
Cl or Br, the isotopic peaks are diagnostic
b)
If
a molecule contains a single bromine atom, the molecular ion would appear:
c)
The
effects of multiple
Cl
and Br atoms is additive – your text has a complete table of the combinations possible with 1-3 of either atom
d)
Sulfur
will give a M+2 peak of 4% relative intensity and silicon 3%
m/e
relative abundance
M
+
M+2
The M+2 peak would be about the size of the M
+
if one Br is present
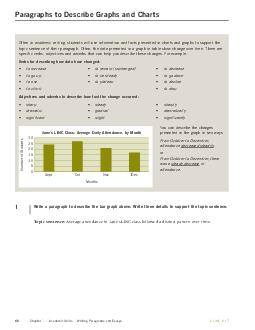
Slide13Mass SpectrometryThe Mass SpectrumPresentation of dataThe mass spectrum is presented in terms of ion abundance vs. m/e ratio (mass)
The most abundant ion formed in ionization gives rise to the tallest peak on the mass spectrum – this is the
base peak
base peak, m/e 43
Slide14Mass SpectrometryThe Mass SpectrumPresentation of data All
other peak intensities are relative to the base peak as a percentage If
a molecule loses only one electron in the ionization process, a
molecular ion
is observed that gives its molecular weight – this is designated as M+ on the spectrum
M
+
,
m/e 114
Slide15Mass SpectrometryThe Mass SpectrumPresentation of data In
most cases, when a molecule loses a valence electron, bonds are broken, or the ion formed quickly fragment to lower energy ions
The
masses of charged ions are recorded as
fragment ions by the spectrometer – neutral fragments are not recorded !
fragment ions
Slide16M+
M+2
Base peak ,m/e =28
Molecular ion, m/z =64
Slide17Mass spectrum of Ethyl bromide
Slide18Molecular ion at m/z=120
Base peak at m/z=105
Slide19THANK
YOU