
modiolus biogenic reefs to climate change A populationbased approach for effective marine management M modiolus reefs are typically characterized by high species diversity Habitat modification ID: 934549
Download Presentation The PPT/PDF document "Vulnerability of Modiolus" is the property of its rightful owner. Permission is granted to download and print the materials on this web site for personal, non-commercial use only, and to display it on your personal computer provided you do not modify the materials and that you retain all copyright notices contained in the materials. By downloading content from our website, you accept the terms of this agreement.


Slide1
Vulnerability of
Modiolus
modiolus biogenic reefs to climate change: A population-based approach for effective marine management
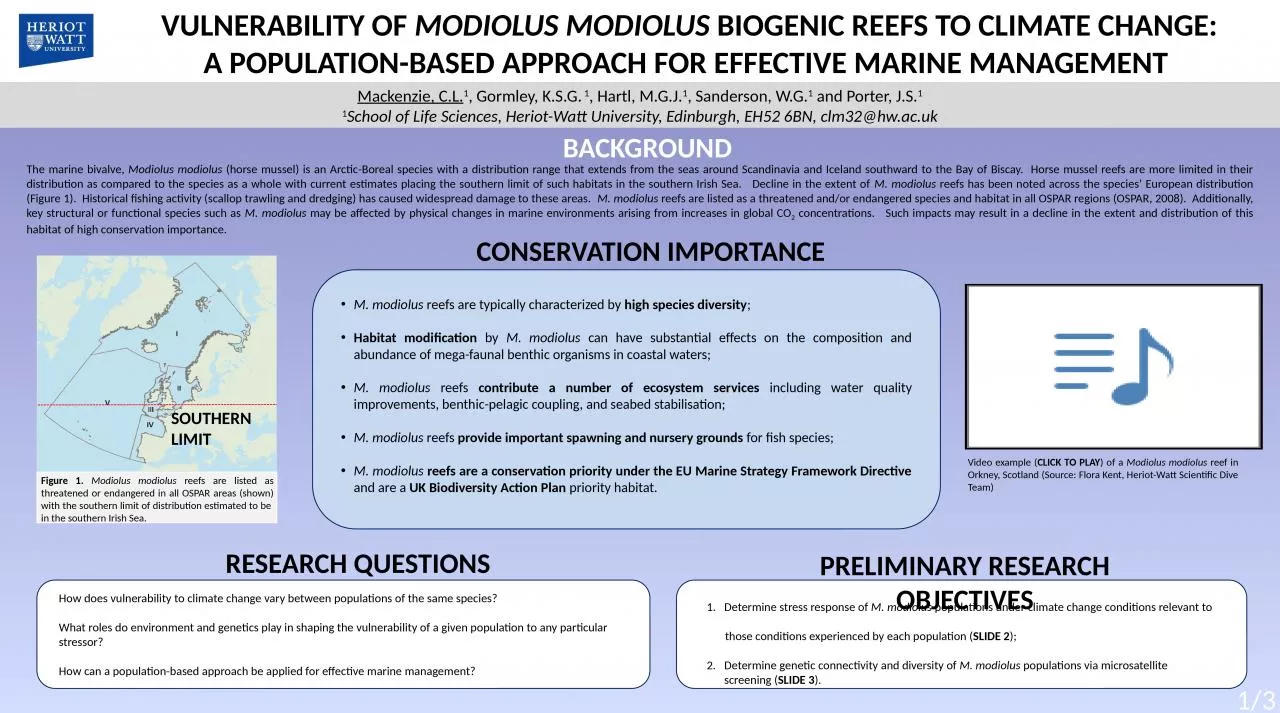
M. modiolus reefs are typically characterized by high species diversity;Habitat modification by M. modiolus can have substantial effects on the composition and abundance of mega-faunal benthic organisms in coastal waters;M. modiolus reefs contribute a number of ecosystem services including water quality improvements, benthic-pelagic coupling, and seabed stabilisation;M. modiolus reefs provide important spawning and nursery grounds for fish species;M. modiolus reefs are a conservation priority under the EU Marine Strategy Framework Directive and are a UK Biodiversity Action Plan priority habitat.
Background
Conservation Importance
The marine bivalve, Modiolus modiolus (horse mussel) is an Arctic-Boreal species with a distribution range that extends from the seas around Scandinavia and Iceland southward to the Bay of Biscay. Horse mussel reefs are more limited in their distribution as compared to the species as a whole with current estimates placing the southern limit of such habitats in the southern Irish Sea. Decline in the extent of M. modiolus reefs has been noted across the species’ European distribution (Figure 1). Historical fishing activity (scallop trawling and dredging) has caused widespread damage to these areas. M. modiolus reefs are listed as a threatened and/or endangered species and habitat in all OSPAR regions (OSPAR, 2008). Additionally, key structural or functional species such as M. modiolus may be affected by physical changes in marine environments arising from increases in global CO2 concentrations. Such impacts may result in a decline in the extent and distribution of this habitat of high conservation importance.
Mackenzie, C.L.1, Gormley, K.S.G. 1, Hartl, M.G.J.1, Sanderson, W.G.1 and Porter, J.S.11School of Life Sciences, Heriot-Watt University, Edinburgh, EH52 6BN, clm32@hw.ac.uk
Preliminary Research Objectives
Determine
stress
response of M. modiolus populations under climate change conditions relevant to those conditions experienced by each population (SLIDE 2);Determine genetic connectivity and diversity of M. modiolus populations via microsatellite screening (SLIDE 3).
Research Questions
How does vulnerability to climate change vary between populations of the same species?
What roles do environment and genetics play in shaping the vulnerability of a given population to any particular stressor? How can a population-based approach be applied for effective marine management?
1/3
Southern limit
Figure 1.
Modiolus modiolus
reefs are listed as threatened or endangered in all OSPAR areas (shown) with the southern limit of distribution estimated to be in the southern Irish Sea.
Video example (CLICK TO PLAY) of a Modiolus modiolus reef in Orkney, Scotland (Source: Flora Kent, Heriot-Watt Scientific Dive Team)
Slide2Vulnerability of
Modiolus
modiolus
biogenic reefs to climate change: A population-based approach for effective marine management MethodologyM. modiolus were collected during May-June 2014 from three populations situated across the UK range of the species and representing varying latitudinal positions (Figure 2);Thermal acclimation experiments were carried out for each population at ambient (i.e. collection temperature) and ambient +5°C temperatures for a 7-day period;Oxidative stress biomarkers of lipid peroxidation (TBARS assay) and DNA damage (Comet assay) in gill tissue were measured after one week of exposure to warming conditions (Figures 3 and 4);Cellular energetics and gene expression samples were also collected at each sampling point for future analyses.
Results
Lleyn Peninsula, Wales
Port Appin, ScotlandOrkney, ScotlandFigure 2. Sampling locations (M. modiolus population sites).
2/3Climate change impacts: How do stress responses vary between sites?
(
i
) DNA strand breaks
Mackenzie, C.L.1, Gormley, K.S.G. 1, Hartl, M.G.J.
1, Sanderson, W.G.1 and Porter, J.S.1
1School of Life Sciences, Heriot-Watt University, Edinburgh, EH52 6BN, clm32@hw.ac.uk
(ii) Lipid peroxidation
Figure 4.
(
i
) DNA strand break (expressed as % tail DNA) and (ii)
lipid peroxidation (expressed as concentration of TBARS per mg protein) in M. modiolus populations (a. Orkney, b. Port Appin, c. Lleyn Peninsula) following exposure to ambient (collection temperature) and warming (ambient + 5°C) conditions. Means ± SE shown for n=4-5.
a..b..c..
Figure
3
. Overview of the Comet Assay.
(CLICK TO PLAY)
END
Slide3Do
M. modiolus
populations vary in their abilities (i.e. phenotypic plasticity) to respond to climate change conditions (under similar stress levels) ?
Do M. modiolus populations with increased inbreeding
and/or decreased genetic variability exhibit decreased resilience and/or physiological plasticity to climate change stressors? Do M. modiolus have the ability to adapt to extended exposure to single/multiple climate change stressors? Vulnerability of Modiolus modiolus biogenic reefs to climate change: A population-based approach for effective marine management Future Research Questions3/3
Conclusions
Results
Figure 6. Larval dispersal (particle tracking model) for Wales M. modiolus population following 10, 20, 30 days (Source: Peter Robins, Bangor University). (CLICK TO PLAY)
MethodologyMackenzie, C.L.1, Gormley, K.S.G. 1, Hartl, M.G.J.1, Sanderson, W.G.1 and Porter, J.S.1
1School of Life Sciences, Heriot-Watt University, Edinburgh, EH52 6BN, clm32@hw.ac.uk
Genetic Connectivity and Diversity:
What is the genetic basis for resilience?
Genetic samples (n=50) were collected from M. modiolus populations across the species’ UK distribution (Figure 5);Genetic screening of each population was carried out using microsatellite markers;PCR product amplification confirmed by gel electrophoresis and genotyping of all markers for all populations completed by University of Dundee;Allele peaks scored and analyses of genetic diversity and connectivity carried out in FreeNA, FSTAT and
Genepop software packages;
Future particle tracking modelling to be carried out to examine alignment of genetic connectivity data and potential larval dispersal (Figure 6).
Preliminary examination of stress response in M. modiolus populations shows that oxidative stress biomarkers have potential use as indicators of climate change induced stress response;Temperatures at the southern limit (Wales) may cause increased levels of oxidative stress in M. modiolus with regards DNA damage;
Given its higher degree of inbreeding and
lower observed heterozygosity (potentially indicating a reduced ability for adaptation to changing
conditions), the southern limit population (Lleyn Peninsula) may be increasingly vulnerable to climate change as compared to other populations
.
Orkney, ScotlandPort Appin, Scotland
Lleyn Peninsula, WalesStrangford Lough, Northern Ireland
Point of Ayre, Isle of Man
Figure 5.
M. modiolus
reef sites for microsatellite screening.
Lleyn
Peninsula
Point of
Ayre
Strangford Lough
Port Appin
Karlsruhe
Lleyn Peninsula
0.0000
0.0239
0.0670*
0.0272*
0.0195*
Point of Ayre
0.0000
0.1031*
0.0098*
0.0367*
Strangford Lough
0.0000
0.0893*
0.0245*
Port Appin
0.0000
0.0339
Karlsruhe
0.0000
Table
1.
Genetic
diversity parameters
Table 2.
Population differentiation (
F
st
values)
N = number of samples; H
e
= Expected Heterozygosity;
H
o
= Observed Heterozygosity; N
A
= number of alleles; A
R
= Allelic Richness;
F
is
=
inbreeding coefficient;
F
st
= differentiation coefficient, (before (upper
diagonal) and after (lower diagonal) ENA
correction)).
*= significant value (p<0.05)
F
st
(before and after ENA correction)
N
H
e
H
oNAARFisLleyn PeninsulaPoint of AyreStrangford LoughPort AppinKarlsruheLleyn Peninsula480.71710.4322 13.010.14± 6.960.400 0.02570.06590.02700.0188Point of Ayre310.62410.5819 9.48.84±5.880.0690.0511 0.10790.01410.0381Strangford Lough510.84500.595820.814.65±8.430.2970.06450.1191 0.08930.0247Port Appin410.66740.6361 14.210.85±9.580.0470.04710.01080.0986 0.0345Karlsruhe540.77950.5769 15.811.75±5.900.2620.02250.04810.02400.0432
K
EY FINDINGS
1. The
Lleyn
Peninsula population has the highest inbreeding coefficient and lowest observed heterozygosity (Table 1).
2. There is significant but generally low genetic differentiation between most populations (Table 2).