
BMICS 776 wwwbiostatwiscedubmi776 Spring 2018 Anthony Gitter gitterbiostatwiscedu These slides excluding thirdparty material are licensed under CC BYNC 40 by Mark Craven Colin Dewey and Anthony Gitter ID: 933477
Download Presentation The PPT/PDF document "Linking Genetic Variation to Important P..." is the property of its rightful owner. Permission is granted to download and print the materials on this web site for personal, non-commercial use only, and to display it on your personal computer provided you do not modify the materials and that you retain all copyright notices contained in the materials. By downloading content from our website, you accept the terms of this agreement.


Slide1
Linking Genetic Variation to Important Phenotypes
BMI/CS 776 www.biostat.wisc.edu/bmi776/Spring 2018Anthony Gittergitter@biostat.wisc.edu
These slides, excluding third-party material, are licensed under
CC BY-NC 4.0
by Mark Craven, Colin Dewey, and Anthony Gitter
Slide2How does the genome vary between individuals?How do we identify associations between genetic variations and simple phenotypes/diseases?How do we identify associations between genetic variations and complex phenotypes/diseases?
2
Outline
Slide3Understanding Human Genetic Variation
T
he “human genome” was determined by sequencing DNA from a small number of individuals (2001)
The
HapMap
project (initiated in 2002) looked at polymorphisms in 270 individuals
(
Affymetrix GeneChip)The 1000 Genomes project (initiated in 2008) sequenced the genomes of 2500 individuals from diverse populations23andMe genotyped its 1 millionth customer in 2015Genomics England plans to sequence 100k whole genomes and link with medical records, 49k so far
3
Slide4Classes of VariantsSingle Nucleotide Polymorphisms (SNPs)
Indels (insertions/deletions)Structural variants4
Formal definitions
:
https://
www.snpedia.com/index.php/Glossary
Slide5Single Nucleotide Polymorphisms (SNPs)
5
One nucleotide changes
Variation
o
ccurs with some minimal
frequency in a populationPronounced “snip”www.mdpi.com
Slide6Insertions and Deletions
6
Forster et al.
Proc. R. Soc.
B
2015
Black box: DNA template strand
White box: newly replicated DNAInsertion: slippage inserts extra nucleotidesDeletion: slippage excludes template nucleotides
Slide7Structural Variants
7Copy number variants (CNVs)
Gain or loss or large
genomic regions
, even entire
chromosomes
Inversions
DNA subsequence is reversedTranslocationsDNA subsequence is moved to a different chromosome
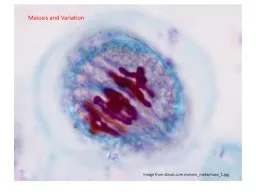
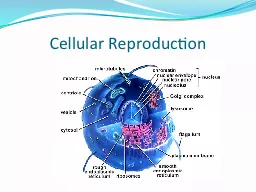
Slide8Genetic Recombination
8
Slide9Recombination Errors Lead to
Copy Number Variants (CNVs)
9
Slide101000 Genomes Project
Project goal: produce a catalog of human variation down to
variants that occur at
>= 1
% frequency
over the genome
10
Slide11Understanding Associations Between Genetic Variation and Disease
Genome-wide
a
ssociation
s
tudy (GWAS)
G
ather some population of individualsGenotype each individual at polymorphic markers (usually SNPs)Test
association between
state
at marker and some variable of interest (say disease)
A
djust
for multiple
comparisons
Phenotypes: observable traits
11
Slide12p = E-5
p = E-3
12
Slide13Wellcome
Trust GWAS13
Slide14Morning Person GWAS
Hu et al.
Nature Communications
2016
P
= 5.0
× 10
−814
Slide15Understanding Associations Between Genetic Variation and Disease
International Cancer Genome Consortium
I
ncludes NIH’s
The Cancer Genome Atlas
S
equencing DNA from 500 tumor samples for
each of 50 different cancersGoal is to distinguish drivers (mutations that cause and accelerate cancers) from passengers
(mutations that are byproducts of cancer’s growth)
15
Slide16A Circos
Plot
16
Slide17Some Cancer Genomes
17
Slide18Understanding Associations Between Genetic Variation and Complex Phenotypes
Q
uantitative trait loci (QTL) mapping
G
ather
some population of individuals
G
enotype each individual at polymorphic markers Map quantitative trait(s) of interest to chromosomal locations that seem to explain variation in trait
18
Slide19QTL Mapping Example
19
Slide20QTL Mapping Example
QTL mapping of mouse blood pressure, heart rate [Sugiyama et al., Broman et al.]
20
quantitative trait
position in the genome
Logarithm of Odds
Slide21QTL Example: Genotype-Tissue Expression Project (GTEx)
Expression QTL (eQTL): traits are expression levels of various genesMap genotype to gene expression in different human tissues
21
Slide22QTL Example: GTEx
22
https://www.genome.gov/27543767/
Slide23GWAS Versus QTL
Both associate genotype with phenotypeGWAS pertains to discrete phenotypesFor example, disease status is binaryQTL pertains to quantitative (continuous) phenotypesHeightGene expression
Splicing events
Metabolite abundance
23
Slide24Determining Association is Not Enough
A simple case: CFTR (Cystic Fibrosis Transmembrane Conductance Regulator)
24
Slide25Many Measured SNPs Not in Coding R
egionsGenes encoding CD40 and CD40L with relative positions of the SNPs studied
Chadha et al.
Eur
J Hum
Genet
2005
25
Slide26Computational Problems
Assembly and alignment of thousands of genomesData structures to capture extensive variationIdentifying functional roles of markers of interest (which genes/pathways does a mutation affect and how?)Identifying interactions in multi-allelic diseases (which combinations of mutations lead to a disease state?)
Identifying genetic/environmental interactions that lead to disease
Inferring network models that exploit all sources of evidence: genotype, expression, metabolic, etc.
Detecting large structural variants
26