
decay is an electromagnetic process where the nucleus decreases in excitation energy but does not change proton or neutron numbers This decay process only involves the emission of photons ID: 933413
Download Presentation The PPT/PDF document "γ - ray spectroscopy γ" is the property of its rightful owner. Permission is granted to download and print the materials on this web site for personal, non-commercial use only, and to display it on your personal computer provided you do not modify the materials and that you retain all copyright notices contained in the materials. By downloading content from our website, you accept the terms of this agreement.


Slide1
γ-ray spectroscopy
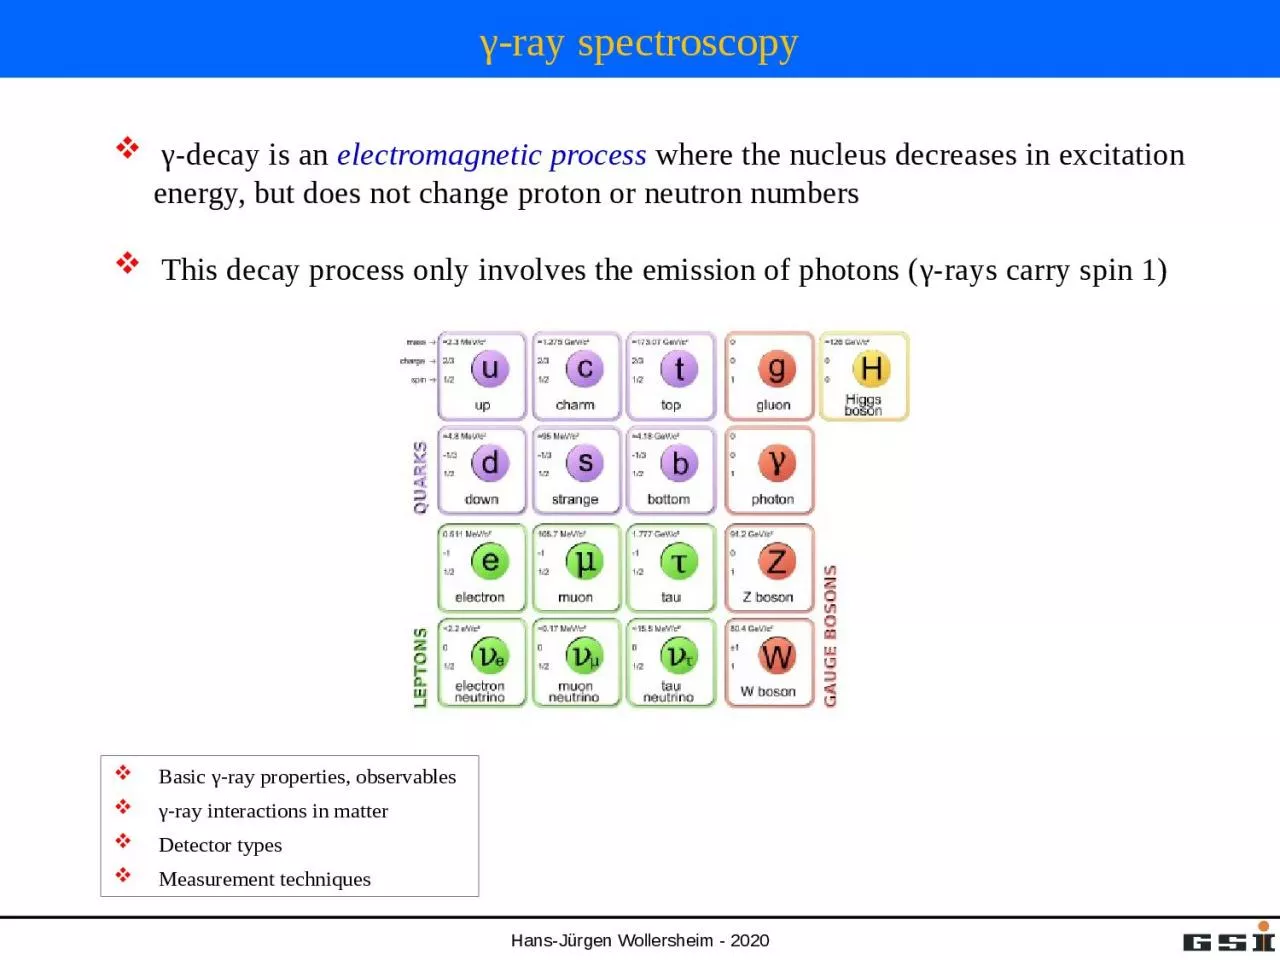
γ-decay is an electromagnetic process where the nucleus decreases in excitation energy, but does not change proton or neutron numbers This decay process only involves the emission of photons (γ-rays carry spin 1)
Basic
γ
-ray properties, observables
γ-ray interactions in matter
Detector types
Measurement techniques
Slide2Electromagnetic spectrum
Slide3γ-decay
Gamma-ray emission is usually the dominant decay mode
137Cs detected in red:
NaI
scintillator
blue:
HPGe
(high purity Ge semiconductor)
Measurements of γ-rays let us deduce: Energy, Spin (angular distr. / correl.), Parity (polarization), magnetic moment, lifetime (recoil distance, Doppler shift), …of the involved nuclear levels.
Slide4γ-decay in a Nutshell
The photon emission of the nucleus essentially results from a re-ordering of nucleons within the shells. This re-ordering often follows α or
β
decay, and moves the system into a more energetically favorable state.
Slide5γ-decay
γ
-ray spectrum of natU
Slide6γ-decay
Most β-decay transitions are followed by γ-decay
.
Slide7Classical Electrodynamics
The nucleus is a collection of moving charges, which can induce magnetic/electric fields The power radiated into a small area element is proportional to
The average power radiated for an electric dipole is:
For a magnetic dipole is
Slide8Electric/Magnetic Dipoles
Electric and magnetic dipole fields have opposite parity:Magnetic dipoles have even parity and electric dipole fields have odd parity.
Slide9Higher Order Multipoles
It is possible to describe the angular distribution of the radiation field as a function of the multipole order using Legendre polynomials.: The index of radiation
: The multipole order of the radiation
The associated Legendre polynomials
are:
For
For
Slide10Angular Momentum in γ-Decay
The photon is a spin-1 boson
Like α-decay and β-decay the emitted γ-ray can carry away units of angular momentum ℓ, which has given us different multipolarities for transitions. For orbital angular momentum, we can have values
that correspond to our
multipolarity
.
Therefore, our selection rule is:
Slide11Characteristics of multipolarity
L
multipolarityπ(Eℓ) / π(Mℓ)angular
distribution
1
dipole
-1 / +1
2
quadrupole
+1 / -1
3
octupole
-1 / +1
4hexadecapole+1 / -1
⁞
ℓ
= 1
ℓ
=2
Slide12The basics of the situation
ℓ 20
Here
this is a stretched transition
Slide13The basics of the situation
ℓ 32
Here
and the transition can be a mix of 5
multipolarities
Slide14The basics of the situation
Electromagnetic transitions:
yes
E1
M2
E3
M4
no
M1
E2
M3
E4
yes
E1
M2
E3
M4
no
M1
E2
M3
E4
Slide15The basics of the situation
ℓ 2+0+
yes
E1
M2
E3
M4
no
M1
E2
M3
E4
yes
E1
M2
E3
M4
no
M1
E2
M3
E4
Slide16The basics of the situation
ℓ 3+2-
Here
yes
E1
M2
E3
M4
no
M1
E2
M3
E4
yes
E1
M2
E3
M4
no
M1
E2
M3
E4
mixed
E1,M2,E3,M4,E5
Slide17The basics of the situation
ℓ 3+2+
Here
mixed
M1,E2,M3,E4,M5
yes
E1
M2
E3
M4
no
M1
E2
M3
E4
yes
E1
M2
E3
M4
no
M1
E2
M3
E4
Slide18The basics of the situation
mixed M1,E2,M3,E4,M5
mixed E1,M2,E3,M4,E5
In general only the lowest 2 multipoles compete
and (for reasons we will see later)
multipole generally only competes if it is electric:
mixed M1/E2
almost pure E1 (very little M2 admixture)
Slide19Characteristics of multipolarity
L
multipolarityπ(Eℓ) / π(Mℓ)angular
distribution
1
dipole
-1 / +1
2
quadrupole
+1 / -1
3
octupole
-1 / +1
4hexadecapole+1 / -1
⁞
parity:
electric multipoles
π
(Eℓ) = (-1)
ℓ
,
magnetic multipoles
π
(Mℓ) = (-1)
ℓ+1
ℓ
= 1
ℓ
=2
The
power radiated
is proportional to:
where
σ
means either
E
or
M
and
is the E or M multipole moment of the appropriate kind.
Slide20Emission of electromagnetic radiation
where E
γ = Ei – Ef is the energy of the emitted γ quantum in MeV (E
i
,
E
f
are the nuclear level energies, respectively), and the reduced transition probabilities B(E
ℓ
) in units of e2(barn)ℓ and
B(Mℓ) in units of
Slide21Single particle transition (Weisskopf
estimate)
For the first few values of λ, the
W
eisskopf
estimates are
gamma energy E
γ
[
keV
]
transition probability
λ [s-1]
Slide22Conversion electrons
Energetics of CE-decay (
i=K, L, M,….)
E
i
=
E
f
+
E
ce,i + EBE,iγ
- and CE-decays are independent; transition probability (λ ~ Intensity)
λT = λγ + λCE = λ
γ
+
λ
K
+
λ
L
+
λ
M
……
Conversion coefficient
Slide23Internal conversion
For an electromagnetic transition internal conversion can occur instead of emission of gamma radiation. In this case the transition energy Q = Eγ will be transferred to an electron of the atomic shell.
T
e
= E
γ
-
B
e
T
e: kinetic energy of the electronBe: binding energy of the electron
internal conversion is important for:heavy nuclei ~ Z3high
multipolarities Eℓ or Mℓsmall transition energies
Slide24Electron spectroscopy
Doppler shift correction for projectile:
Slide25Mini Orange setup for conversion electron spectroscopy
Slide26Comparison of α-
decay, β-decay and γ
-decay
de Broglie wavelength:
decay
Energy [MeV]
de Broglie
λ
[
fm
]
α
-particle, m
α
= 3727
MeV
/c
2
5
6.42
β
-particle, m
e
= 0.511
MeV
/c
2
1
871.92
γ
-
photon
1
decay
Energy [MeV]
de Broglie
λ
[
fm
]
α
-particle, m
α
= 3727
MeV
/c
2
5
6.42
β
-particle, m
e
= 0.511
MeV
/c
2
1
871.92
γ
-
photon
1
For
α
-particles
this dimension is somewhat smaller than the nucleus and this is why a semi-classical treatment of
α
-decay is successful
.
The typical
β
-particle
has a large wavelength
λ
in comparison to the nuclear size and a quantum mechanical is dictated and wave analysis is called for.
For
γ
-
decay
the wavelength
λ
ranges
from 12400
– 1240
fm
(0.1 – 1 MeV
).
Clearly, only a quantum mechanical approach has a chance of success.
Slide27γ-decay
γ-spectroscopy yields some of the most precise knowledge of nuclear structure, as spin, parity and ΔE are all measurable
.Transition rates between initial and final
nuclear states, resulting from electromagnetic decay producing a photon with energy
can be described by Fermi´s Golden rule:
where
is the electromagnetic transition operator and
is the density of final states. The photon wave function
and
are well known, therefore measurements of
λ
provide detailed knowledge of nuclear structure.
A
γ
-decay lifetime is typically 10
-12
[s]
and sometimes even as short as 10
-19
[s]. However, this time span is an eternity in the life of an excited nucleon. It takes about 4·10
-22
[s] for a nucleon to cross the nucleus.
Slide28Interaction of gamma rays with matter
total
absorption coefficient
:
μ
/
ρ
[cm
2
/g]
Lead
i=1 photoelectric effect
i=2 Compton scattering
i=3 pair production
Aluminum
Slide29Mass dependence of X-ray absorption
For X-ray radiation the
photoelectric effect
is the most important interaction
.
Lead
absorbs more than
Beryllium!
82
Pb
serves as shielding for X-ray and
γ
-ray radiation; lead vests are used by medical staff people who are exposed to X-ray radiation
. Co-sources are transported in thick lead container
.
On
the contrary
:
4
Be
is often used as windows
in
X-ray tubes to allow for almost undisturbed transmission of X-ray radiation.
Slide30Mass dependence
μ/ρ of X-ray absorption
wave length dependence for Pt as absorber
element number dependence for
λ
=0.1
nm or 12.4
keV
Slide31X-ray image shows the effect of different absorptions
Bones absorb more radiation as tissues because of their higher
20
Ca content
Slide32Interaction of gamma rays with matter
Slide33Interaction of gamma rays with matter
Photo effect:
Absorption of a photon by a bound electron and conversion of the
γ
-energy in potential and kinetical energy of the ejected electron.
(Nucleus preserves the momentum conservation
.)
Slide34Interaction of gamma rays with matter
Compton scattering:
Elastic scattering of a
γ
-ray on a free electron. A fraction of the
γ
-ray energy is transferred to the Compton electron. The wave length of the scattered
γ
-ray is increased:
λ
‘ >
λ.
relativistic
Momentum balance:
Energy balance:
Slide35Interaction of gamma rays with matter
Compton scattering:
Elastic scattering of a
γ
-ray on a free electron. A fraction of the
γ
-ray energy is transferred to the Compton electron. The wave length of the scattered
γ
-ray is increased:
λ
‘ >
λ.
Maximum energy of the
scattered electron:
Energy of the scattered
γ
-photon:
Special case for E>>m
e
c
2
:
γ-ray energy after 180
0
scatter
is approximately
Gap between the incoming
γ
-ray and the maximum electron energy.
Slide36Interaction of gamma rays with matter
σ
Compton
Compton scattering:
Elastic scattering of a
γ
-ray on a free electron. A fraction of the
γ
-ray energy is transferred to the Compton electron. The wave length of the scattered
γ
-ray is increased:
λ
‘ >
λ
.
Slide37Interaction of gamma rays with matter
Compton scattering:
Elastic scattering of a
γ
-ray on a free electron.
The angle dependence is expressed by the
Klein-Nishina-Formula:
As shown in the plot
forward scattering
(
θ
small) is dominant for E
γ
>100 keV.
Angular distribution:
Intensit
y as a function of
θ
:
MeV
r
0
=2.818
fm
(classical electron radius)
Slide38Interaction of gamma rays with matter
Pair production:
If
γ
-ray energy is >> 2m
0
c
2
(electron rest mass 511 keV), a positron-electron pair can be formed in the strong Coulomb field of a nucleus. This pair carries the
γ
-ray energy minus 2m
0c2.Pair production for E
γ>2mec2=1.022MeV
γ
-ray > 1 MeV
magnetic field
γ
’s
e
-
picture of a bubble chamber
Slide39Interaction of gamma rays with matter
γ
-rays interaction with matter via three main reaction mechanisms:
Photoelectric absorption
Compton scattering
Pair production
Slide40Gamma-ray interaction cross section
All three interaction (photo effect, Compton scattering and pair production) lead to an attenuation of the
γ
-ray or X-ray radiation when passing through matter.
The particular contribution depends on the
γ
-ray energy:
The absorption attenuates the intensity, but the energy and the frequency of the
γ
-ray and X-ray radiation is preserved!
Photo
effect
: ~Z
4-5
, E
γ
-3.5
Compton: ~Z, E
γ
-1
Pair: ~Z
2
,
increases
with
E
γ
Slide41Z dependence of interaction probabilities
Slide42Detector types
Solid state semiconductor detectors: GeElectron-hole pairs are collected as chargeknock-on effect → an avalanche arrives at the electrodelots of electrons → good energy resolutioncooled to liquid N2 temperature (77K) to reduce noiseAdvantage:
good energy resolution (~0.15% FWHM at 1.3 MeV)Disadvantage: relative low efficiency, cryogenic operation, limited size of crystal/detectorScintillation detectors: e.g. NaI, BGO, LaBr3(Ce)Recoiling electrons excite atoms, which then de-excite by emitting visible lightLight is collected in photomultiplier tubes (PMT) where it generates a pulse proportional to the light collectedAdvantage: good time resolution detector can be made relative large e.g. NaI detector 14”Ø x 10” no need for cryogenics
Disadvantage:
poor energy resolution (~5% FWHM at 1.3 MeV
Slide43Scintillation detectors
Slide44Detector characterization
Slide45Gamma-ray spectrum of a radioactive decay
γ
1
γ
2
CE
γ
2
SE
γ
2
DE
γ
2
511 keV
BSc
Pb X-ray
γ
1
+
γ
2
Pb-Box
Slide46Spins and parities
Two distinct types of measurements:Angular correlation : can be done with a non-aligned source but need γ-γ coincidence information.Angular distribution: need an aligned source but can be done with singles data....note that these cannot measure parity but you can usually infer something about the transition
Slide47The basics of the situation
Imagine the situation of an M1 decay between two states, the initial one has Jπ value of 1+ and the final one a Jπ of 0+
The initial Jπ=1+ state has 3 degenerate magnetic substates which differ by the magnetic quantum numbers m of and 0. The final Jπ=0+ state has a single magnetic
substate
with m=0.
When the
substates
of
J
π
=1+ state decay, the γ-rays emitted have different angular patterns.
Slide48The basics of the situation
For the M1 case the angular distributions W(θ) are:So the total distribution is
no angular dependence
Slide49Angular correlation – non-oriented source
E1
Let’s imagine we have two
γ
-
rays which follow immediately after each other in the level scheme.
If we measure
γ
1
or
γ2 in singles, then the distribution will be isotropic (same intensity at all angles) ... there is no preferred direction of emissionNow imagine that we measure γ1 and γ2 in coincidence. We say that measuring γ1
causes the intermediate state to be aligned.
We define the z-direction as the direction of
γ
1
The angular distribution of the
emission of
γ
2
then depends on the spin/parities
of the states involved and on the
multipolarity
of the transition.
Slide50A simple example:
E1
1
+
0
+
0
+
Hence, for
γ
2
we only see the m=±1 to m=0 part of the distribution i.e. we see that the intensity measured as a function of angle (relative to
γ
1
)
follows a
distribution.
Slide51General formula
E1
J
2
J
3
J
1
where
θ is the relative angle between the two
γ
-raysQk accounts for the fact that we do not have point detectorsAk
depends on the details of the transition and the spins of the level
In general, the
γ
-ray intensity varies as:
I
1
(
ℓ
1
)
I
2
(
ℓ
2
)
I
3
a
2
a
4
0
(
1
)
1 (
1
)
0
1
0
1 (
1
)
1 (
1
)
0
-1/3
0
1 (
2
)
1 (
1
)
0
-1/3
0
2 (
1
)
1 (
1
)
0
1/13
0
3 (
2
)
1 (
1
)
0
-3/29
0
0 (
2
)
2 (
2
)
0
-3
4
1 (
1
)
2 (
2
)
0
-1/3
0
2 (
1
)
2 (
2
)
0
3/7
0
2 (2)
2 (
2
)
0
-15/13
16/13
3 (
2
)
2 (
2
)
0
-3/29
0
4 (
2
)
2 (
2
)
0
1/8
1/24
R.D. Evans, The Atomic Nucleus
Slide52General formula
E1
J
2
J
3
J
1
where
θ is the relative angle between the two
γ
-raysQk accounts for the fact that we do not have point detectorsAk
depends on the details of the transition and the spins of the level
In general, the
γ
-ray intensity varies as:
https://griffincollaboration.github.io/AngularCorrelationUtility/
Ferentz
-Rosenzweig
coefficients
Slide53A special case:
Slide54Angular correlations with arrays
Many arrays are designed symmetrically, so the range of possible angles is reduced.Therefore one measures a Directional Correlation from Oriented Nuclei (DCO ratio)In the simplest case, if you have an array with detectors at 350 and 900.Gate on 900 detector, measure coincident intensities in
other 900 detectors350 detectorsTake the ratio and compare with calculations ... can usually separate quadrupoles from dipoles but cannot measure mixing ratios
Slide55Angular correlations with arrays
Slide56Angular distribution - fusion
In heavy-ion fusion-evaporation reactions, the compound nuclei have their spin aligned in a plane perpendicular to the beam axis:
Depending on the number and type of particles ‘boiled off’ before a
γ
-ray is emitted, transitions are emitted from
oriented
nuclei and therefore their intensity shows an angular dependence.
where
A
k
,
Q
k
and
P
k
are as before and
B
k
contains information about the alignment of the state
Slide57Angular distribution
Measure: the γ-ray yield as a function of θ
Slide58Angular distribution: Coulomb excitation
(30
0,1800
)
(for
m=0 and stretched E2)
(for
m=0 and stretched E2)
Slide59Linear polarization
A segmented detector can be used to measure the
linear polarization which can be used to distinguish between magnetic (M) and electric (E) character of radiation of the same multipolarity.The Compton scattering cross section is larger in the direction perpendicular to the electrical field vector of the radiation.
Define experimental asymmetry as:
where N
90
and N
0
are the intensities of scattered photons perpendicular and parallel to the reaction plane.
The experimental linear polarization
P=A/Q
where Q is the polarization sensitivity of the detector
Q~13% at 1 MeV
Slide60Linear polarization
Maximum polarization at
θ
=90
0
Klein-
Nishina
formula
:
Slide61Proof of Principle
N. Pietralla, Nucl Instr Meth A483, 556 (2002)
Slide62Linear polarization
Slide63Laser Compton backscattering
Energy – momentum conservation yields
Doppler upshiftThomsons scattering cross section is very small (6
·10
-25
cm
2
)
High photon and electron density are required
Slide64Efficiency versus resolution
With a source at rest, the intrinsic resolution of the detector can be reached;
efficiency decreases with the increasing detector-source distance.
With a moving source also the effective energy resolution depends on the detector-source distance (Doppler effect)
Small
d
Large
d
Large
W
Small
W
High eLow ePoor FWHMGood FWHM
Slide65Energy resolution
The major factors affecting the final energy resolution (FWHM) at a particular energy are as follows:
The intrinsic resolution of the detector system.
It includes contributions from the detector itself and
the electronic components used to process the signal
.
The Doppler broadening arising from the opening angle of
the detectors
The Doppler broadening arising from the angular spread of the recoils in the target
The Doppler broadening arising from the velocity (energy)
variation of the excited nucleus
Slide66Special relativity
Lorentz transformation:
Slide67Lorentz transformation
rest system
laboratory systemP* = const.total energy:
with
E
*
, P
*
total energy and momentum in the rest system
E, P total energy and momentum in the laboratory system
Doppler formula
for zero-mass particle (photon): E=Pc
E.
Byckling
, K.
Kajantie
J. Wiley & Sons London
Hendrik Lorentz
Slide68Doppler effect
for
Slide69Doppler broadening and position resolution
Position resolution
Angular resolution
Energy resolution
beam
projectile
g
ray
Slide70Doppler broadening (opening angle of detector)
with
for
Slide71Doppler broadening (velocity variation)
for
with
Slide72Experimental arrangement
experimental problem:
Doppler broadening due to finite size of Ge-detector
for
For projectile excitation:
with
Doppler shift
Doppler broadening
Slide73Inelastic heavy-ion scattering
raw
γ-ray spectrum181
Ta
238
U
Slide74Lorentz transformation
γ
-ray angular distributionContraction of the solid angle element in the laboratory system
with
Doppler formula
Slide75Experimental arrangement (electron detection)
Doppler broadening
Δϑe = 200target – Mini-Orange: 19 cmMini-Orange – Si detector: 6 cmFor projectile excitation:
with
Slide76Lorentz transformation
γ
-raysγ-raysenergy shift
solid angle contraction
10%
2
0%
Slide77Segmented detectors
70cm
20cm
beam
target
Slide78Recoil distance method
Slide79Doppler Shift Attenuation Method
target
stopper
beam
Germanium
detector
Slide80Gamma-ray tracking
Gamma Arrays based on Compton Suppressed Spectrometers
Tracking Arrays based onPosition Sensitive Ge Detectors
ε
~
50 - 25
%
(
M
γ = 1 - Mγ
= 30)
ε ~ 10 - 7 % ( M
γ
= 1 –
M
γ
= 30
)
GAMMASPHERE
EUROBALL
GRETA
AGATA