
Kaelynn M Rose 1 Robin S Matoza 1 1 Department of Earth Science and Earth Research Institute University of California Santa Barbara CA USA Poster No P23708 P23708 ABSTRACT A climactic eruption phase on December 22 2018 triggered the collapse of the southwest flank and summit o ID: 933139
Download Presentation The PPT/PDF document "Remote hydroacoustic and infrasonic dete..." is the property of its rightful owner. Permission is granted to download and print the materials on this web site for personal, non-commercial use only, and to display it on your personal computer provided you do not modify the materials and that you retain all copyright notices contained in the materials. By downloading content from our website, you accept the terms of this agreement.


Slide1
Remote hydroacoustic and infrasonic detection and characterization of eruptive activity leading to, during, and following the December 2018 major flank collapse and tsunami at Anak KrakatauKaelynn M. Rose1, Robin S. Matoza1
1Department of Earth Science and Earth Research Institute, University of California, Santa Barbara, CA, USA
Poster No. P2.3-708
Slide2P2.3-708ABSTRACTA climactic eruption phase on December 22, 2018 triggered the collapse of the southwest flank and summit of Anak Krakatau stratovolcano, generating a tsunami which struck the coastlines of Sumatra and Java. We employ a selection of remote moored hydroacoustic and infrasonic stations of the International Monitoring System (IMS) to investigate eruptive activity preceding, during, and after the climactic eruption phase. We observe 7 months of co-eruptive intermittent infrasound at IS06 and powerful infrasound from the climactic eruption on IS06 and IS52. The climactic eruption phase was not detected hydroacoustically, but we observe a ~12-day swarm of hydroacoustic signals beginning 24 days before the flank collapse event that we attribute to sustained submarine eruptive activity at Anak Krakatau.
Remote hydroacoustic and infrasonic detection and characterization of eruptive activity leading to, during, and following the December 2018 major flank collapse and tsunami at Anak Krakatau
Kaelynn M. Rose
1
, Robin S. Matoza
1
1
Department of Earth Science and Earth Research Institute, University of California, Santa Barbara, CA, USA
Figure 1.
Sentinel-2 thermal satellite images of Anak Krakatau from just before the start of the new eruptive phase in June 2018 to three months after the flank collapse in March 2019. The intact volcanic flank and cone are shown in the June 2, 2018 image. Ash plumes and lava flows are then visible until November 2018, but clouds and ash obscured satellite imagery until after the flank collapse and tsunami on December 22, 2018. The first clear image of Anak Krakatau after the flank collapse is on January 1, 2019 which shows a large steam plume from Surtseyan eruption activity, followed by two images of the new edifice morphology and crater lake in January and March 2019. This short wave infrared spectral range (SWIR) satellite imagery is compiled from bands 12, 8A, and 4 of the Sentinel-2 satellite and was obtained using Sentinel Hub Playground (Modified Copernicus Sentinel Data, 2019).
Slide3P2.3-708INTRODUCTIONAnak Krakatau is a highly active, partially-submerged stratovolcano located in the Sunda Strait of IndonesiaA new eruptive phase began in June 2018, and peaked on December 22, 2018
A period of intense eruption triggered a flank collapse, generating a powerful tsunami in the Sunda Strait, and was followed by ~19 days of explosive Surtseyan eruption activityWe use data from the infrasound and hydroacoustic stations of the IMS global network to investigate the eruption and place the flank collapse event in context with 7 months of previous eruption activity
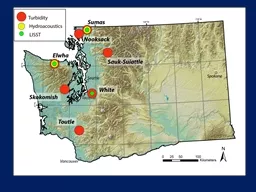
Figure 2.
The location of Anak Krakatau volcano (red triangle) in the Sunda Strait, Indonesia, and IMS infrasound and hydroacoustic stations. Infrasound stations are shown as squares, and hydroacoustic stations are shown as circles; filled symbols are stations used in this study. On the azimuthal map, the open black triangles show locations of potentially active subaerial volcanoes, and the open blue triangles show locations of submarine volcanoes (Global Volcanism Program 2013). The bathymetry map was created using the ETOPO1 1 Arc-Minute Global Relief Model (
Amante
& Eakins, 2009). The inset satellite map uses a visual-band image from the Sentinel-2 satellite, taken at the start of the new eruptive phase on June 19, 2018 (modified Copernicus Sentinel Data 2019). IMS: International Monitoring System.
Remote hydroacoustic and infrasonic detection and characterization of eruptive activity leading to, during, and following the December 2018 major flank collapse and tsunami at Anak Krakatau
Kaelynn M. Rose
1
, Robin S. Matoza
1
1
Department of Earth Science and Earth Research Institute, University of California, Santa Barbara, CA, USA
Slide4P2.3-708METHODSArray Processing: PMCC MethodWe perform array processing for infrasound and hydroacoustic data from June 5, 2018 through January 31, 2019 using the Progressive Multi-Channel Correlation (PMCC) method (
Cansi, 1995; Le Pichon et al., 2010) PMCC uses time-domain correlation to measure signal delays between array elements, detect coherent signals, and estimate wavefront parameters (backazimuth, apparent velocity) for a set of filter bandpasses. We demonstrate the effectiveness of a log-frequency band implementation of PMCC for hydroacoustic data processing, consistent with work by Vergoz
& Millet (2019) and Vergoz et al. (2019).
For the infrasound station PMCC processing we used 15 frequency bands log-spaced from 0.01-9.9 Hz corresponding to window lengths ranging from 30 to 200 s (Matoza et al., 2013), and for the hydroacoustic stations we used 40 frequency bands log-spaced from 0.01-120 Hz with window lengths ranging from 30 to 400 s.
Azimuth
(degree)
Speed
(km/s)
Figure 3.
Figure 4. PMCC result for one explosion from Anak Krakatau on December 1, 2018, on hydroacoustic station H08S. The top panel shows the waveform, the middle panel shows back-azimuth degree of detections, and the bottom panel shows apparent velocity of detections.
Remote hydroacoustic and infrasonic detection and characterization of eruptive activity leading to, during, and following the December 2018 major flank collapse and tsunami at Anak Krakatau
Kaelynn M. Rose
1
, Robin S. Matoza
1
1
Department of Earth Science and Earth Research Institute, University of California, Santa Barbara, CA, USA
Slide5P2.3-708RESULTS
Remote hydroacoustic and infrasonic detection and characterization of eruptive activity leading to, during, and following the December 2018 major flank collapse and tsunami at Anak KrakatauKaelynn M. Rose1, Robin S. Matoza
1
1
Department of Earth Science and Earth Research Institute, University of California, Santa Barbara, CA, USA
Figure 4.
Station IS06 infrasound detections of eruptive activity leading up to, during, and after the flank collapse and tsunami at Anak Krakatau. (a) PMCC summary detections for infrasound activity from June 3, 2018, through January 31, 2019. At least 8 sequences of eruptive activity are recorded before the main eruption with flank collapse begins (black arrow). Two example sequences of eruptive infrasound in the months prior to the flank collapse are selected with blue dashed rectangles and detailed in the lower panels. (b) PMCC detections, the waveform, and spectrogram activity for a sequence of activity
from August 3-11, 2018. (c) The same for activity from October 7-11, 2018. The waveforms were time-delay beamformed and high-pass filtered above 0.7 Hz to remove microbarom noise, and the spectrograms were beamformed. The horizontal black dashed lines on each PMCC detection plot show the back-azimuth direction of Anak Krakatau, and the solid red circles behind the waveforms indicate times of PMCC bulletin (summary) detections that were within ±3° of the volcano back-azimuth.
IS06 is the closest IMS infrasound station to Anak Krakatau and recorded the most robust set of remote acoustic detections linked to this eruption.
These infrasound detections have an overall mean frequency of 2.7 Hz (mean refers to average values for pixels in a family), with pulses of activity lasting from hours up to ~3 days each, separated by periods of quiescence.
On December 18-22, 2018, station IS06 recorded intermittent detections from Anak Krakatau with a mean frequency of 2.1 Hz, which became continuous at ~06:43 UTC on December 22, 2018 and marked the start of powerful Strombolian style eruptive activity.
Beginning December 22, 2018, IS06 records 19 days of powerful, nearly continuous infrasound associated with the main eruption phase (intense Strombolian activity followed by the flank collapse, tsunamis, and the onset of Surtseyan activity).
Slide6P2.3-708RESULTS
Remote hydroacoustic and infrasonic detection and characterization of eruptive activity leading to, during, and following the December 2018 major flank collapse and tsunami at Anak KrakatauKaelynn M. Rose1, Robin S. Matoza
1
1
Department of Earth Science and Earth Research Institute, University of California, Santa Barbara, CA, USA
Figure 5.
(a)
Comparison of PMCC summary infrasound detections. The back-azimuth of Anak Krakatau is indicated on each panel with a gray dashed line, and the time of the flank collapse at ~13:55 on December 22, 2018 is indicated by a vertical red dashed line. Eruptive activity at Anak Krakatau is detected infrasonically at IS06 and IS52. Krakatau detections at IS52 are partially obscured by microbarom clutter, but the histogram of detections for the time range of the plot shows a significant peak in detections near the direction of the volcano. Blue lines on the histograms indicate the median back-azimuth of all detections in each panel. (b) Detection cross-bearings for infrasound stations IS06 and IS52 where coherent eruptive detections are observed, calculated using the median back-azimuth of detections at each station during the eruption period. The great circle paths at the median back-azimuth directions are indicated with solid teal lines. Anak Krakatau is indicated by a red triangle. The back-azimuth intersection of the cross-bearings is 128 km from true. (c) Comparison of PMCC summary hydroacoustic detections, parsing only detections with mean frequencies of 1–15 Hz to reduce ocean clutter (background hydroacoustic signals). The main eruption and flank collapse were not detected hydroacoustically, but H08S and H01W detect a 12-day hydroacoustic swarm ending 12 days before the main eruption began. Blue lines on the histograms indicate median back-azimuth of detections of suspected volcanic activity (black rectangle). (d) Detection cross-bearings for H08S and H01W hydroacoustic swarm. The back-azimuth intersection of the cross-bearings is 100 km from true.
The hydroacoustic PMCC detections at H08S do not show continuous detections from the direction of Anak Krakatau during the main eruption sequence, possibly due to low SNR caused by interference from a marine seismic survey (Rose, 2020).
However, detection results show a 12-day swarm of nearly continuous hydroacoustic signal arriving at H08S from the Anak Krakatau back-azimuth beginning 24 days before the flank collapse and tsunami, from November 29 through December 11, 2018
We also observe consistent hydroacoustic detections at H01W, from November 30 through December 4, 2018
The presence of this co-eruptive swarm suggests that the eruption produced a period of submarine activity (or earthquakes in the solid Earth coupled to the water column) coincident with subaerial eruptive activity.
Slide7P2.3-708RESULTS
Remote hydroacoustic and infrasonic detection and characterization of eruptive activity leading to, during, and following the December 2018 major flank collapse and tsunami at Anak KrakatauKaelynn M. Rose1, Robin S. Matoza
1
1
Department of Earth Science and Earth Research Institute, University of California, Santa Barbara, CA, USA
Figure 7.
(
a,b
) Hydroacoustic waveform and (c) spectrogram of H08S data from November 29, 2018 to December 11, 2018, encompassing 24-12 days before the onset of the climactic eruption and flank collapse. The waveform and spectrogram have been beamformed in the direction of Krakatau. Panel (b) shows a reduced pressure range from -5 to 5 Pa to show detail of smaller events. Solid teal circles on the waveforms indicate coherent PMCC detections from the direction of Anak Krakatau, which we interpret as submarine eruption activity. Panels (d) and (e) show that the hydroacoustic events with corresponding PMCC detections tend to be impulsive and band-limited from ~3 to < 40 Hz.
Figure 6.
(
a,b
) Hydroacoustic waveform and (c) spectrogram of H08S data from November 29, 2018 to December 11, 2018, encompassing 24-12 days before the onset of the climactic eruption and flank collapse. The waveform and spectrogram have been beamformed in the direction of Krakatau. Panel (b) shows a reduced pressure range from -5 to 5 Pa to show detail of smaller events. Solid teal circles on the waveforms indicate coherent PMCC detections from the direction of Anak Krakatau, which we interpret as submarine eruption activity. Panels (d) and (e) show that the hydroacoustic events with corresponding PMCC detections tend to be impulsive and band-limited from ~3 to < 40 Hz.
Slide8P2.3-708RESULTS
Remote hydroacoustic and infrasonic detection and characterization of eruptive activity leading to, during, and following the December 2018 major flank collapse and tsunami at Anak KrakatauKaelynn M. Rose1, Robin S. Matoza
1
1
Department of Earth Science and Earth Research Institute, University of California, Santa Barbara, CA, USA
Figure 8.
Timeline of eruption. Magenta circles indicate days with Sentinel-2 satellite thermal anomaly detections (modified Copernicus Sentinel Data 2019), teal circles indicate reported Surtseyan eruption (Global Volcanism Program, 2019), red circles indicate days where lava flows were reported (Global Volcanism Program, 2019), gray circles indicate days with eruption plumes reported (Global Volcanism Program, 2019), and blue circles indicate days on which volcano-seismic events or eruption tremor at Anak Krakatau were reported by PVMBG (Pusat
Vulkanologi
dan
Mitigasi
Bencana
Geologi
, 2018). Blue rectangles show the duration of hydroacoustic PMCC detections from H08S and H01W, and orange rectangles show duration of infrasound detections from IS06 and IS52. (
b,c
) PMCC hydroacoustic pixel detections. (
d,e
) PMCC infrasound bulletin (summary) detections. Horizontal dashed black line on panels (b-e) indicates back-azimuth direction of Anak Krakatau, and vertical red dashed lines indicate the approximate time of the flank collapse which triggered the tsunami. (f) Infrasound (IS06) and hydroacoustic (H08S) events. Infrasound events were picked using network STA/LTA with PMCC cross-checking method, while hydroacoustic events were picked manually corresponding to PMCC detections. (g) SAR satellite imagery from Sentinel-1 and thermal and visual satellite imagery from Sentinel-2 showing the effects of the eruption on the morphology of the volcanic edifice (modified Copernicus Sentinel Data 2019). The diameter of the island measured from its most northern to most southern point is approximately 2.2 km. STA/LTA: short-term average/long-term average; PMCC: Progressive Multi-Channel Correlation; PVMBG: Indonesian Centre of
Vulcanology
and Geological Hazard Mitigation.
Slide9P2.3-708METHODSHydroacoustic Event SimilarityWe create a starting catalog of hydroacoustic PMCC detections by manually selecting events based on PMCC detections from November 29 to December 11, 2018, where each event has at least 5 successive PMCC detections, for a total of 247 events.
Following Green & Neuberg (2006), Matoza & Chouet (2010), and Green et al. (2013), but using the hydroacoustic envelope instead of the waveform, we calculate event similarity using cross-correlation for each of the hydroacoustic event envelopes with every other event, logging the maximum correlation coefficient into an m-by-m matrix, where m is the number of detection events (m=247 here).
We subsequently attempt to cluster the H08S hydroacoustic events into groups of similar signals (or “multiplets”) based on a correlation-coefficient threshold of 0.75 (Green & Neuberg, 2006).
Remote hydroacoustic and infrasonic detection and characterization of eruptive activity leading to, during, and following the December 2018 major flank collapse and tsunami at Anak Krakatau
Kaelynn M. Rose
1
, Robin S. Matoza
1
1
Department of Earth Science and Earth Research Institute, University of California, Santa Barbara, CA, USA
Slide10P2.3-708RESULTS
Remote hydroacoustic and infrasonic detection and characterization of eruptive activity leading to, during, and following the December 2018 major flank collapse and tsunami at Anak KrakatauKaelynn M. Rose1, Robin S. Matoza
1
1
Department of Earth Science and Earth Research Institute, University of California, Santa Barbara, CA, USA
Figure 9.
(a) The two largest hydroacoustic envelope multiplets at H08S based on a correlation coefficient of 0.75. Waveforms were filtered from 2-15 Hz, beamformed, normalized, and the 6 s rolling mean calculated. Individual envelopes of the multiplets are shown in gray, and the master envelope stack of each multiplet in a black solid (multiplet 1) or dashed (multiplet 2) line. (b) Event matrices for the multiplets in chronological order with the first event at 0. The events are aligned via cross-correlation to the best-correlated envelope in the multiplet. (c) The 247 events with greater than 5 PMCC detections as the maximum amplitude of the event with time (black crosses) and identifies the events assigned to the multiplet (red crosses). (d) Comparison of the average envelope of multiplet 1 and multiplet 2, aligned by maximum amplitude. (e) Example envelopes from December 1, 2018 with PMCC detections from the direction of Anak Krakatau (interpreted as volcanic) and (d) clutter envelopes (possible earthquakes). The interpreted volcanic waveforms on (e) are solid if they belong to multiplet 1, and dashed if they belong to multiplet 2. Multiplet 1 envelopes show a slightly sharper onset and slightly sharper decline than multiplet 2 envelopes, and both multiplets differ significantly from the clutter waveforms, which we interpret as earthquakes based on observations of volcanic vs. tectonic earthquake multiplets in
Talandier
&
Okal
(2001).
Hydroacoustic Event Similarity Results
Slide11P2.3-708CONCLUSIONSConclusionsThe eruptive activity leading up to, during, and following the 2018 major flank collapse and tsunami at Anak Krakatau was captured remotely on infrasound and hydroacoustic stations of the IMS global monitoring network (IS06, 1,156 km range; IS52, 3,638 km range; H08S, 3,307 km range; and H01W, 3,720 km range)
Our analysis complements previous studies of this eruption by placing the catastrophic flank collapse and tsunami in the context of 7 months of prior eruption activity and post-collapse Surtseyan activity. We observe a 12-day hydroacoustic swarm from the direction of Anak Krakatau which coincided with eruption infrasound and which we interpret as submarine eruptive activity which ceased before the onset of the main eruption sequence.
This swarm may represent volcanic earthquakes coupling to the water column through seismo-acoustic conversion or underwater explosive magma-seawater interactions. Repetitive waveform envelopes with pulse durations of ~20-seconds for the hydroacoustic swarm with minor variations suggest repetitive volcanic activity possibly with variations in mechanism and/or location (e.g., changes in earthquake hypocenter and seismo-acoustic coupling location, changes of underwater explosion mechanism source-time-function, etc.)
Our results are of utility in the design of future systems to automatically detect submarine volcanism in order to warn ships and aircraft of possible maritime volcanic hazards.
Remote hydroacoustic and infrasonic detection and characterization of eruptive activity leading to, during, and following the December 2018 major flank collapse and tsunami at Anak Krakatau
Kaelynn M. Rose
1
, Robin S. Matoza
1
1
Department of Earth Science and Earth Research Institute, University of California, Santa Barbara, CA, USA
Slide12Remote hydroacoustic and infrasonic detection and characterization of eruptive activity leading to, during, and following the December 2018 major flank collapse and tsunami at Anak KrakatauKaelynn M. Rose1, Robin S. Matoza11
Department of Earth Science and Earth Research Institute, University of California, Santa Barbara, CA, USA
P2.3-708
References
Amante
, C. & Eakins, B. W. (2009). ETOPO1 1 Arc-minute Global Relief Model: Procedures, Data Sources and Analysis. NOAA Technical Memorandum NESDIS NGDC-24, http://
dx.doi.org
/10.7289/V5C8276M Beyreuther, M., Barsch, R., Krischer, L., Megies, T., Behr, Y., & Wassermann, J. (2010). ObsPy: A Python Toolbox for Seismology. Seismol. Res. Lett., 83(3), 530–533.Cansi, Y. (1995). An automatic seismic event processing for detection and location: the P.M.C.C. method.
Geophys. Res. Lett., 22(9), 1021–1024.Global Volcanism Program (2013). Volcanoes of the World, v. 4.9.0 (04 Jun 2020).
Global Volcanism Program. (2019). Report on Krakatau (Indonesia) (
Krippner
, J.B., and Venzke, E., eds.). (J. B.
Krippner
& E. Venzke, Eds.), Bulletin of the Global Volcanism Network (Vol. 44). https://
doi.org
/https://
doi.org
/10.5479/si.GVP.BGVN201903-262000
Green, D. N., &
Neuberg
, J. (2006). Waveform classification of volcanic low-frequency earthquake swarms and its implication at
Soufrière
Hills Volcano, Montserrat. J.
Volcanol. Geotherm. Res., 153(1–2), 51–63. https://doi.org/10.1016/j.jvolgeores.2005.08.003Green, D. N., Evers, L. G., Fee, D., Matoza, R. S., Snellen, M., Smets, P., & Simons, D. (2013). Hydroacoustic, infrasonic and seismic monitoring of the submarine eruptive activity and sub-aerial plume generation at South Sarigan, May 2010. J. Volcanol
. Geotherm. Res., 257, 31–43. https://
doi.org
/10.1016/j.jvolgeores.2013.03.006
Le Pichon, A., Matoza, R. S.,
Brachet
, N., &
Cansi
, Y. (2010). Recent enhancements of the PMCC infrasound signal detector.
Inframatics
.
Matoza, R. S., &
Chouet
, B. A. (2010). Subevents of long-period seismicity: Implications for hydrothermal dynamics during the 2004-2008 eruption of Mount St. Helens. J.
Geophys
. Res. Solid Earth, 115(B12206). https://
doi.org
/10.1029/2010JB007839
Matoza, R. S.,
Landès
, M., Le Pichon, A.,
Ceranna
, L., & Brown, D. (2013). Coherent ambient infrasound recorded by the International Monitoring System.
Geophys
. Res. Lett., 40(2), 429–433. https://
doi.org
/10.1029/2012GL054329
Modified Copernicus Sentinel Data. (2019). 2018-2019, Sentinel Hub. Retrieved June 22, 2020, from https://
sentinels.copernicus.eu
/documents/247904/690755/
Sentinel_Data_Legal_Notice
Pusat
Vulkanologi
dan
Mitigasi
Bencana
Geologi
. (2018). Daily Geologic Disaster Reports (in Indonesian).
Rose, K. M. (2020). Remote Hydroacoustic and Infrasonic Detection and Characterization of Anak Krakatau Eruptive Activity Leading To, During, and Following the December 2018 Major Flank Collapse and Tsunami (Master’s thesis). University of California, Santa Barbara.
Vergoz
, J., & Millet, C. (2019). On the use of acoustic waveforms for localizing bolides: The large 2018/12/18 Bering Sea event. In Infrasound Technology Workshop 2019 (ITW2019). Aqaba, Jordan.
Vergoz
, J.,
Cansi
, Y., Cano, Y., & Gaillard, P. (2019). Analysis of Hydroacoustic Signals Associated to the Loss of the Argentinian ARA San Juan Submarine. In CTBT Science and Technology (
SnT
) 2019 Conference.
Hofburg
, Vienna, Austria. Retrieved from https://ctnw.ctbto.org/ctnw/abstract/33155
Wessel, P., & Smith, W. H. F. (1991). Free software helps map and display data. Eos, Trans. Am.
Geophys
. Union, 72(41), 441–446. https://
doi.org
/10.1029/90EO00319
Acknowledgements
This work was made possible by the Virtual Data Exploitation Centre (
vDEC
–
https://www.ctbto.org/specials/vdec
) platform of the CTBTO that allows access to IMS data for civilian and scientific applications. The views presented in this work are those of the authors and do not necessarily represent the views of the CTBTO or any other institution mentioned herein.
This work was supported by NSF grant EAR-1847736 awarded to Matoza.
This research used data from seismic network code IM (International Monitoring System) downloaded from the IRIS DMC (http://
www.iris.edu
). Modified Copernicus Sentinel data from the European Space Agency (ESA) is available from Sentinel Hub (https://
apps.sentinel-hub.com
/
eo
-browser/). Data analysis and plotting included the use of
ObsPy
(
Beyreuther
et al., 2010), PMCC (Le Pichon et al., 2010), and GMT (Wessel & Smith, 1991).