

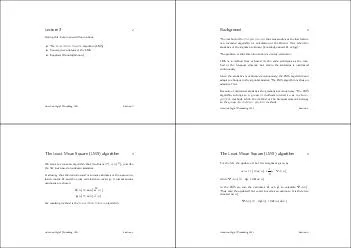
Observational Analytical Epidemiological Studies Raed Khalid Alotaibi Imam Abdulrahman Bin Faisal University rkalotaibiiauedusa 966508284310 Declaration of any conflicts of interest ID: 933305
Download Presentation The PPT/PDF document "www.carteeh.org Lecture #27:" is the property of its rightful owner. Permission is granted to download and print the materials on this web site for personal, non-commercial use only, and to display it on your personal computer provided you do not modify the materials and that you retain all copyright notices contained in the materials. By downloading content from our website, you accept the terms of this agreement.


Slide1
www.carteeh.org
Slide2Lecture #27: Observational Analytical Epidemiological Studies
Raed Khalid Alotaibi
Imam Abdulrahman Bin Faisal University
rkalotaibi@iau.edu.sa
+966508284310
Declaration of any conflicts of interest
Lecture Track(s): HT
Slide3Experimental Design and Causal Inference
A procedure conducted by changing the level of the variable of interest in a controlled environment to examine the effect on an outcome.
Slide4Experimental Design and Causal Inference
Slide5Study Designs and Types
Slide6Study Designs and Types
Descriptive
Analytic
Comparison group
No
Yes
Nature
Observational
Observational or Experimental
Answers the …
What, who, where and when
Why and how
Describes the …
Place, person and time
Strengths of association between X and Y
Hypothesis
Generates hypothesis
Test hypothesis
Examples
Case studies, cross-sectional, and ecological
Experimental, cohort, case-control and case-crossover
Slide7Cohort Studies
Disease
No
Disease
Total
Incidence Rates of Disease
Exposed
A
B
A+B
A / (A+B)
Non-Exposed
C
D
C+D
C / (C+D)
Slide8Cohort Studies
Slide9Case-Control Studies
Disease
No
Disease
Exposed
A
B
Non-Exposed
C
D
Total
A+C
B+D
Odds of exposure
A / C
B / D
Odds Ratio
(A/C) / (B/D)
Slide10Case-Control Studies
Slide11Cross Sectional Studies
Disease
No
Disease
Total
Exposed
A
B
A+B
Non-Exposed
C
D
C+D
Total
A+C
B+D
A+B+C+D
Slide12Cross Sectional Studies
Disease
No
Disease
Total
Exposed
A
B
A+B
Non-Exposed
C
D
C+D
Total
A+C
B+D
A+B+C+D
Disease
No
Disease
Total
Exposed
5
14
19
Non-Exposed
11
42
53
Total
16
56
72
Slide13Time Series
Sequence of health-related measurements
Regular time intervals
Is there a temporal pattern indicating an association?
Slide14Time Series
The Epidemic curve:
Exposure source
Exposure durationLikely exposure periodIncubation periodMagnitude of outcome
Time trend in outcome
Slide15Time Series - Example
Per capita cigarette consumption and male lung cancer incidence in the United States over the last century.
Source:
Doss, M., 2016. Changing the paradigm of cancer screening, prevention, and treatment.
Dose-Response
,
14
(4), p.1559325816680539.
Slide16Summary
Study Design
Description
Strength
Weakness
Cross sectional
“Snapshot” in time. Both exposure and disease status are collected. May be used to measure frequency and prevalence of disease or exposure.
Easy and inexpensive to conduct.
Can measure multiple exposure and outcomes simultaneously.
Control over measurements and study population
Can determine prevalence
Temporality cannot be determined
Potential bias if low response rate
Not optimal for rare exposure or outcomes
Cannot determine incidence or relative risk
Case-Control
Individuals with outcome are compared to those without the outcome in terms of their exposure status.
Effective for rare outcomes
Less expensive and time consuming to cohort studies.
Determines the odds ratio (in rare outcomes the odds ratio is a good estimate of the relative risk)
Potential recall bias
Cannot determine incidence or prevalence
Only one outcome may be studied
Cohort
Study starts with exposure status and individuals are followed up. Outcome rates are compared between exposed and non-exposed. Can be either retrospective or prospective.
“Gold standard” for observational studies
Temporality established (time sequence of events
Able to determine incidence and relative risk
Expensive to conduct
Time consuming
Not optimal for rare outcomes
Time Series
A sequence of health-related outcomes or measurements are gathered over several time periods.
Determine temporality or sequence of events
Determine change in health-related events over time
In infectious disease outbreaks may be able to determine the point source of infection
Generate hypothesis of causality
Ecological bias
Potential age, cohort, and period effect.
Slide17Sources and references
Merrill, R.M., 2008. Environmental epidemiology: principles and methods. Jones & Bartlett Learning.
https://www.cdc.gov/training/quicklearns/exposure/index.html
Doss, M., 2016. Changing the paradigm of cancer screening, prevention, and treatment. Dose-Response, 14(4), p.1559325816680539.
Kannel
, W.B. and McGee, D.L., 1979. Diabetes and cardiovascular disease: the Framingham study. Jama, 241(19), pp.2035-2038.
Belanger, C.F.,
Hennekens
, C.H., Rosner, B. and
Speizer
, F.E., 1978. The nurses’ health study. Am J
Nurs
, 78(6), pp.1039-1040.
Zmirou
, D., Gauvin, S., Pin, I.,
Momas
, I., Sahraoui, F., Just, J., Le
Moullec
, Y.,
Bremont
, F.,
Cassadou
, S., Reungoat, P. and Albertini, M., 2004. Traffic related air pollution and incidence of childhood asthma: results of the Vesta case-control study. Journal of Epidemiology & Community Health, 58(1), pp.18-23.Vert, C., Sánchez-Benavides, G., Martínez, D.,
Gotsens
, X.,
Gramunt
, N.,
Cirach
, M.,
Molinuevo
, J.L.,
Sunyer
, J.,
Nieuwenhuijsen
, M.J.,
Crous-Bou
, M. and Gascon, M., 2017. Effect of long-term exposure to air pollution on anxiety and depression in adults: A cross-sectional study. International journal of hygiene and environmental health, 220(6), pp.1074-1080.
Schwartz, J. and Marcus, A., 1990. Mortality and air pollution j
london
: a time series analysis. American journal of epidemiology, 131(1), pp.185-194.
Slide18Rothman, K.J., Greenland, S. and Lash, T.L. eds., 2008. Modern epidemiology. Lippincott Williams & Wilkins.Gordis 2014. Epidemiology, Philadelphia, PA, Saunders/Elsevier.Szklo, M. and Nieto, F.J., 2014. Epidemiology: beyond the basics. Jones & Bartlett Publishers.
Reading List