

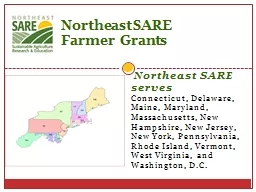
Jake Dyer Maine Potato Board Project Details 10552700 awarded for 2 year project Funded by Northeast SARE LNE17358 Plot and f ield t rial components Build upon results from trials in 2016 ID: 931771
Download Presentation The PPT/PDF document "Developing Best Management Practices for..." is the property of its rightful owner. Permission is granted to download and print the materials on this web site for personal, non-commercial use only, and to display it on your personal computer provided you do not modify the materials and that you retain all copyright notices contained in the materials. By downloading content from our website, you accept the terms of this agreement.


Slide1
Developing Best Management Practices for Pulse and Oilseed Crops in the Northeast
Jake DyerMaine Potato Board
Slide2Project Details
$105,527.00 awarded for 2 year project
Funded by Northeast SARE (LNE17-358)Plot and field trial components
Build upon results from trials in 2016
Slide3Project Purpose
Work with growers to initiate the inclusion of pulse and oilseed crops in potato rotations
Work with existing growers to improve production
Highlight benefits that pulse and oilseeds can have on potato cropping systems
Develop best management practices specific to the Northeast
Slide4Plot Trials
pH
OM
CEC
P
K
S
Mg
Ca
6.24.18.841.8 lb/a543 lb/a18 ppm330 lb/a3064 lb/a
pHOMCECPKSMgCa5.93.45.919.3 lb/a424 lb/a9 ppm289 lb/a1674 lb/a
Westfield
Presque Isle
WestfieldYellow Field Peas – vty, fertility, seed treatmentRed Lentils – row spacingKabuli Chickpea – row spacingFava Beans – seeding rate
Presque IsleCanola – vty, fertility, seeding rate
All plot trials RCB X 3 Rep
Slide5Field Pea Plot Trials
Target Population = 9 pl/ft2 (392,040 pl/acre)
AAC Lacombe 96% germination 1391 SPP
340
lb
/a
CDC Saffron
96% germination
1454 SPP
312 lb/a
Slide6Field Pea Plot Trials
Planting Date: May 16Herbicide: May 18 (Dual II Mag @ 1.4pt + Spartan Charge @ 6oz)
Fertilizer: May 18Flowering Date: July 07Plant Counts: July 07Plant Height: July 17
Desiccate: August 09
Harvest: August 16
Slide7Field Pea Plot Trials
7 TreatmentsSaffron Pea – untreated + 0 fertility
Saffron Pea - treated seed + 100 lb/a KMAG (0-0-21-10.6Mg-21S)Saffron Pea – treated seed + 150
lb
/a (7.3-18.6-16.8-5.45Mg-10.9S)
Saffron Pea – treated seed + 0 fertility
Lacombe Pea – treated seed + 100
lb
/a KMAG
(0-0-21-10.6Mg-21S)Lacombe Pea – treated seed + 150 lb/a (7.3-18.6-16.8-5.45Mg-10.9S)Lacombe Pea – treated seed + 0 fertility
Slide8Field Pea Plot Trial Results and Discussion
On average, plant stands were 120% of target population
Yields averaged 3512 lbs/a across treatments (3013-3978 lbs/a)No effect with regards to fertilizer, seed treatment, or variety
Lodging and diseases were not problematic
Plant heights averaged 25 inches
Test weight average 69
lb
/
bu
(66-72 lbs/bu)Pre-emergence herbicides worked wellRe-growth of peas due to late season moisture
Slide9Red Lentil Plot Trial
Target Population = 13.5 pl/ft2 (588,000 pl
/a)CDC Maxim96% germination11,869 spp
57.3
lb
/a
2 Treatments
7 inch row spacing
14 inch row spacing
Slide10Red Lentil Plot Trial
Planting Date: May 16Pre Emergence Herbicide: May 18 (Dual II
Mag @ 1.4 pt/a) Post Emergence Herbicide: June 20 (Beyond @ 6 oz/a)Fertilizer:
None
Fungicide:
Priaxor
@ 8oz/a on July 19
Flowering Date: July
12
Plant Counts: July 07Plant Height: July 16Desiccate: August 09Harvest: August 16
Slide11Red Lentil Plot Trial Results and Discussion
Plant stands in 7 inch rows were 114% of target vs. 83% in 14 inch rowsYield in 7 inch rows was 1666 lbs
/a vs. 1380 lbs in 14 inch rowsDisease pressure was low and no foliar diseases were notedLodging was more severe in 14 inch row spacing
Plant height averaged 13.5 inches
Test weight average 65
lb
/
bu
Dual/Beyond combo worked well – best if use pre/post combination
Slide12Red Lentil Plot Trial
Slide13Chickpea Plot Trial
Target Population = 4 pl/ft2 (174,500 pl
/a) Frontier Kabuli Chickpea88% germination1281
spp
172
lb
/a
1 Treatment
14 inch row spacing
No seed inoculant – Ammonium Sulfate split application
Slide14Chickpea Plot Trial
Planting Date: May 16Herbicide: May 18 (Dual II Mag @ 1.4pt + Spartan Charge @ 6oz
)Fertilizer: 200 lb/a AS (41-0-0-48S) split (June 07 and July 19)Fungicide: Priaxor
@ 8oz/a on July 19
Flowering Date: July
Plant Counts: July 07
Plant Height: July
17
Desiccate: August
31Harvest: September 07
Slide15Chickpea Yield Results and Discussion
Primarily for informational purposes to better see how crop performs2016 trials used seed inoculant and 7 inch row spacing, diseases were an issue and plants would not die off
naturally2018 no inoculant used and 14 inch row spacing, diseases were not an issue, plants began to naturally senesce and were eventually desiccated.
Plant stands averaged 60% of target (depth/compaction)
Yields averaged 1930
lb
/A
Slide16Faba Bean Plot Trial
Snodrop Faba Bean
87% germination1315 spp
3 Treatments
4
pl
/ft2 = 174,2040 – 169
lb
/a
6 pl/ft2 = 261,360 – 253 lb/a8 pl/ft2 = 348,480 – 338 lb/a
Slide17Faba Bean Plot Trial
Planting Date: May 16Herbicide:
not usedFertilizer: not usedFungicide: not usedFlowering Date: July
03 – July 19
Plant Counts: July 07
Plant Height: July 17
Desiccate: August 31
Harvest: September 07
Slide18Faba Bean Plot Trial
Plant stands: 135% of target @ 4
pl/ft2114% of target @ 6 pl/ft2146% of target @ 8 pl
/ft2
Plant height increased with population
Lodging increased with population
Disease pressure was low – late season disease difficult to diagnose as plant turns black with maturity
Slide19Faba Bean Yield Results and Discussion
1st year experimenting with
Faba beansHave the ability to fix >100 lbs/n/aNeed to be seeded as early as possible
– long season crop
Struggled through hot dry weather
Had to hand harvest due to equipment constraints
– likely led to yield loss
Yields:
1552 lbs/a @ 4pl/ft21794 lbs/a @ 6pl/ft21684 lbs/a @ 8pl/ft2
Slide20Canola Plot Trials
2 Trials: Management Practice + Variety TrialManagement Practice Trial
Fertility, Seeding Rate, VarietyVariety Trial Variety, Seeding Rate
Slide21Canola Plot Trials
Management Practice Trial – GSP vs. OtherGoal: Evaluate seeding rate, variety, and fertilizer
Seeding Date: May 29Fertilizer Date: June 01Herbicide Date: June 22 – 16 oz/a glyphosate @ 2-3 leafDesiccate: August 27
Harvest Date: September 07
Slide22Canola Plot Trials
Management Practice TrialGSP5
lb/a : DK 30-42 : 78N-0-54KOther 8.6 lb/a : CL HyClass
955 : 80N-30P-49K-34S-10.8Mg
Slide23Canola Plot Trials
Preliminary ResultsUp to 60% reduction in seeding rate vs. actual population
Soil conditions, depth, seedling mortalityPlant stands improved with increased seeding rate
Canola responds to sulfur
Yield increase when sulfur is added to fertilizer blend
Canola hybrid selection can increase yield
Selecting modern hybrids bred for direct cutting systems
Highest yields were achieved when a combination of BMP’s are used
Slide24Canola Plot Trials
Variety TrialGoal: Evaluate 5 varieties over 3 seeding ratesSeeding Date: May 29
Fertilizer Date: June 01 (80-30-50-1.6Mg-34S-6.8Ca)Herbicide Date: June 22 – 16 oz/a glyphosate @ 2-3 leafDesiccate: August 27
Harvest Date: September 07
Slide25Canola Plot Trials
Variety TrialDK 30-42DynaGro
533GDynaGro 544Croplan HyClass 955
Croplan
HyClass
970
All RR varieties
@ 5, 8, 11
lbs/A (5-10 plants/ft2)
Slide26Canola Plot Trials
Preliminary ResultsYields ranged from 890 – 2035 lb
/AYield appears to be related to final plant standYield appears to be related to varietyWeed control was unsatisfactory – pre-emergence product should have been used in combination w/glyphosate
Slide27Field Demonstration Trials
WestfieldSunflowers
MapletonSunflowersYellow Field PeasCanola
Slide28Field Pea Field Trials
MapletonVariety: AAC Lacombe
Target Seeding Rate: 340 lb/a (392,040 pl/a)Seeding Date: May 19
Herbicide: Pre – 1.33
pt
/a Dual II Mag + 6
oz
Spartan 4F
Fertility: 11-28-25-8Mg-16S applied pre plant incorporated
Emergence: May 30 (11 DAP)Harvest Date: Sept 5+6 (91-92 DAP)
Slide29Field Pea Field Trials
Treatments (Strips)Reg. Seed, Treated, Pea Blend
Fert, Rolled PriorCert. Seed, Treated, Pea Blend Fert, Rolled After
Cert. Seed, Treated, Pea Blend, KMAG, Rolled After
Cert. Seed, Untreated, Pea Blend, Rolled After
Cert. Seed, Untreated, Pea Blend, KMAG, Rolled After
Cert. Seed, Treated, Pea Blend, KMAG, Rolled Prior
Fungicide (Strips) – Applied on July 09
Stratego
YLD @ 4.8 ozAproach @ 12 ozEndura @ 11 oz
Slide30Field Pea Field Trials
May 30
June 11
June 20
Slide31Field Pea Trials
July 16 - Fungicide
August 10 -
Dessicated
August 21
Slide32Field Pea Field Trials
August 27
September 06
September 06
Slide33Field Pea Trials Results and Discussion
Pre-Emergence herbicides worked very wellLow disease pressure – no noticeable difference between fungicides
Rolling after seeding = better emergence, although all treatments were above seeding targetLodging – not an issueHeat blast = increased pod abortion and reduced pod set and yieldRe-Flowering = 1
st
time seeing this…likely due to 4.6 in rain in August
Yields averaged 3007
lbs
/a (50
bu
/a)Highest yielding strips had 100 lb KMAG 0-0-21-10.6Mg-21S
Slide34Sunflower Field Trials
Held on 2 farms in Mapleton and WestfieldVariety Info:
Croplan 549 CL 95 RM Clearfield Trait
Slide35Sunflower Field Trials
MapletonPlanting Date: May 29-30
Planting Method: Grain DrillHerbicide: Beyond @ 6 oz/a postTarget Population: 28,000
Actual Population: 22,400 (80% of Target)
Row Spacing: 18”
Fertility: 50
lb
N, 75
lb
N, 100 lb NFungicide: Quash @ 4 oz/A
Slide36Sunflower Field Trials
Westfield Planting Date: June 08
Planting Method: Precision planterHerbicide: Dual II Mag @10.64 oz/a
Spartan 4F @ 6
oz
/A
Target Population: 30,000
Actual Population:
27,351 (91% of Target)
Row Spacing: 36”Fertility: 65 lb NFungicide: None
Slide37Sunflower Field Trials
Mapleton Harvest Date: Oct 26
Yield: 50 lb/N = 1820 lb/a 75
lb
/N = 2100
lb
/a
100
lb/N = 2660 lb/aWestfield Harvest Date: Nov 02 Yield: 2428 lb/a Yield would likely have been higher…October 24
Slide38Sunflower Field Trial Results and Discussion
Sunflowers are slow to emerge…13 to 14 DAP – soil temp critical
Much more consistent stand when using planter vs. grain drill 91% vs. 80% of target planting population Improved seed singulation
Consistent head size
Pre-emergence herbicide controlled weeds better than post product alone
White mold preventative fungicide should be considered ($40/a
)
65-100
lbs N for best yields
Slide39Canola Field Trials
MapletonPlanting Date: May 23
Fertilizer: 78-0-54Variety: DK 30-42Herbicide Date: June 15 (Glyphosate)Topdress Fertility: June 27 (Kmag
@ 100 and 200
lb
/A)
Fungicide: Quash
Desiccate: August 22
Harvest: August 31-September 03
Slide40Canola Field Trial
Goal: To evaluate seeding rate and sulfur response Strips of 5 and 6
lb/a seeding rate and 100 or 200 lb/Kmag Yield monitor from combine used to estimate yield
Preliminary Results: Slight yield advantage to 6
lb
/A + 200
lb
/a
Kmag
Slide41Acknowledgments
Buck FarmsW.C. Doyen and SonsSmith’s Farm
Aroostook FarmCavendish Agri-ServicesNutrien Ag