
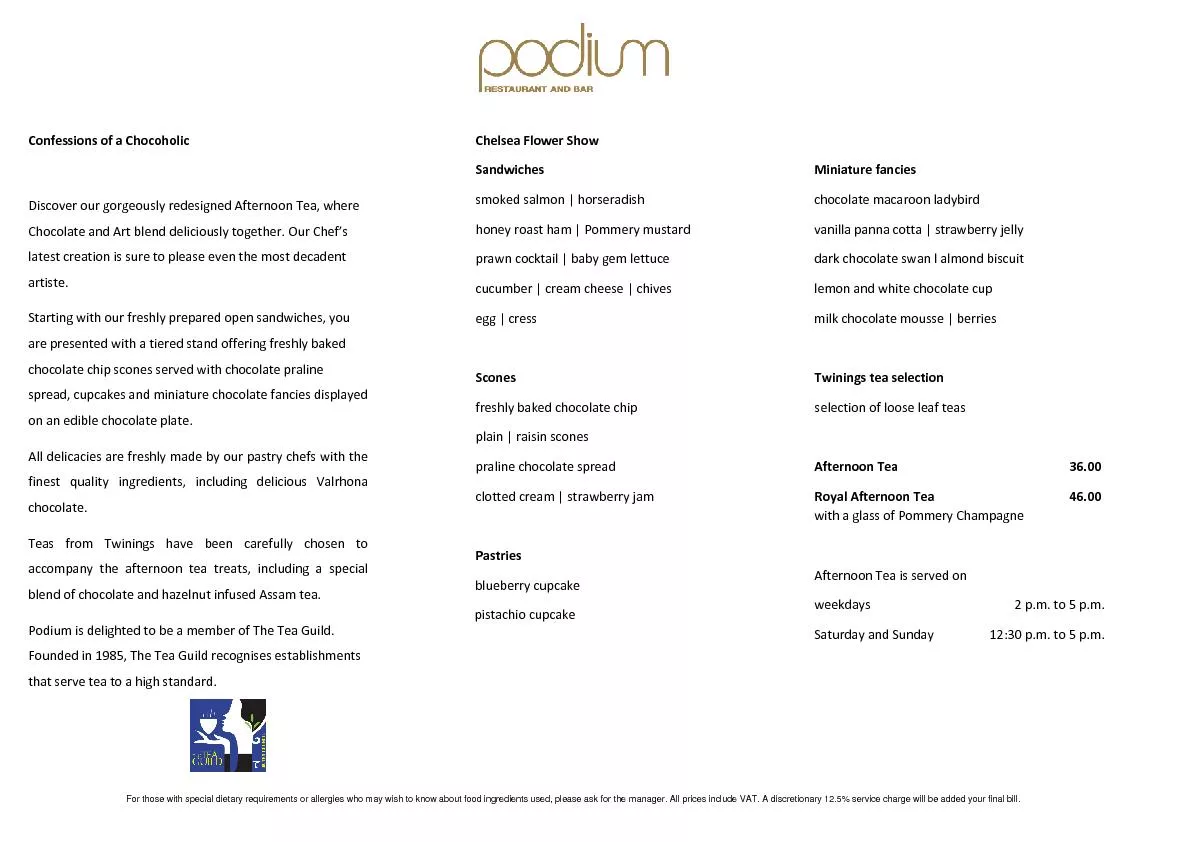
sulphur amino acids after weaning is there a case for increasing their level of inclusion in diets Dr John Pluske School of Veterinary and Life Sciences Western Australia Todays presentation ID: 935402
Download Presentation The PPT/PDF document "Dietary requirements for tryptophan and" is the property of its rightful owner. Permission is granted to download and print the materials on this web site for personal, non-commercial use only, and to display it on your personal computer provided you do not modify the materials and that you retain all copyright notices contained in the materials. By downloading content from our website, you accept the terms of this agreement.


Slide1
Dietary requirements for tryptophan and sulphur amino acids after weaning: is there a case for increasing their level of inclusion in diets?
Dr. John PluskeSchool of Veterinary and Life Sciences, Western Australia
Slide2Today’s presentationWeaning process“Essentiality” of some essential amino acidsTryptophanSulphur
amino acidsConcluding comments
Slide3Weaning is a stressful event
Removal from sow and littermates
Fighting and establishment
of social hierarchy
Change in
environment
Increased exposure
to pathogens
Abrupt transition in diet
Transportation
stress
(Slide: Courtesy of Dr
J.Campbell
, APC)
Slide4The post-weaning malaise
(Wellock et al., 2013;
The Pig
J.
69:
56
-
74)
Slide5Pattern of TNF-
α mRNA expression in the proximal, mid-, and distal SI in the proximal colon of the intestine of piglets on the day of weaning (d 0) and on d 1, 2, 5, and 8 after weaningWeaning increases production of
pro-inflammatory cytokines
Weaning is associated with an early and transient response in gene expression of pro-inflammatory cytokines in the gut
The
(transient)
rise corresponds with both low feed intake and the
stress (disease?)
associated with weaning
(Pie
et al
., 2004
; J.
Nutr
. 134: 641-651)
Slide6What is the impact of weaning (and all that goes with it – disease, stress…) on the young pigs’ nutrient requirements?
Slide7Immune system activation affects performance of pigs (6-27 kg LW)
Item
Immune system activation
Dietary lysine, % of the diet
0.60
0.90
1.20
1.50
Daily gain, grams
Low
400
556
644
663
High
357
495
510
504
Daily feed intake, grams
Low
896
1025
1052
1002
High
889
954
889
911
Gain:feed
, g per
g
Low
445
544
613
662
High395522581565
(Williams et al., 1997; J. Anim. Sci. 75: 2463-2471)
Slide8Pigs without clinical disease signs can still perform poorer
Oral infection with
Lawsonia
intracellularis
(LI)
Clinical infection 10
8
-10
6
LI per pig
Subclinical infection 10
5-10
4 LI per pig
(
Paradis
et al., 2012; J. Swine. Health Prod
. 20: 137–141)
Slide9Immunonutrition: Using selected essential amino acids to restore the structure and function of the gut more rapidly and efficiently
Slide101. Tryptophan
Slide11BackgroundWeaners reared in unsanitary
(‘dirty’) conditions without antimicrobials show poorer growth rate and lower plasma
Trp
levels (compared to medicated
feed and
pigs housed
in
‘clean’ rooms)
Plasma
Trp
concentration
decreases during chronic lung inflammation of pigs associated with increased
Trp catabolism [indicated by greater induction of indoleamine
2,3 dioxygenase
(IDO) activity]IDO activation creates conditions that favor immune suppression and tolerance
Studies have also shown that additional Trp supplementation,Allows
susceptible [to F4
enterotoxigenic (ETEC) E. coli infection] pigs to partially compensate for the effects of ETEC challenge by
increasing feed intake and maintaining adequate growthFavourably interacts to reduce the bacterial induction of some genes involved in the intestinal barrier in
ETEC-susceptible pigs
Slide12Linear response of protein deposition to increasing Trp intake with immune system activation
(Levesque et al
.,
2011; In
Proceedings of the Canadian Nutrition Society,
ON, Canada)
Immune system activation
NO immune system activation
(Pigs, 20 kg BW; LPS given
i.m
. to cause stimulation)
≈12%
difference
Slide13Trp requirements under commercial conditions: is the optimum above SID Trp:Lys of 0.16 (NRC, 2012)?
Rationale:Under commercial conditions (‘inflammatory state’),
pig performance will increase with increased levels of
dietary
Trp
Under commercial conditions (‘inflammatory state’), markers of inflammation
will
be
ameliorated in
pigs fed higher levels of
Trp
than pigs fed lower
levels
Slide14Methods
Six Tryptophan:Lysine ratios in dietTwo diets formulated (low and high)
n= 7 pens/treatment (total of 2,160 pigs weaned
@ 19-23 d of age
)
Experimental
diets
(with
ZnO
) fed
for 2
wks
after weaning
followed by a commercial
weaner
diet
Feed distributed by Feedlogic
® system
Blood samples taken on d 4 and 11
analysed
for C-reactive protein (acute phase protein) as a
measure
of inflammation
Calculated SID
Trp:Lys
Corrected SID
Trp:Lys
0.16
0.168
0.18
0.182
0.20
0.205
0.22
0.211
0.24
0.2340.260.253
Slide15P < 0.05 (1-way ANOVA)
(Capozzalo
et al
., 2013; In
Manipulating Pig Production XIII
, p. 91)
Slide16a
a
a
a
a
b
P < 0.05 (1-way ANOVA)
(
Capozzalo
et al
., 2013; In
Manipulating Pig Production XIII
, p. 91)
Slide17Expressing daily gain and feed intake on a Trp intake basis shows a different result
(y = 242.52 + 51.45x, RSD = 27.07, R2 = 0.171, P = 0.009)
(y = 268.38 + 136.33x, RSD = 28.63
,
R
2
= 0.563, P
< 0.001
)
(
Capozzalo
, 2015; PhD Thesis, Murdoch University)
Slide18(Burger et al.,
1998)P < 0.05 (1-way ANOVA)
Slide19Main conclusions from this studyLinear improvements in gain and feed intake
Pigs fed Trp:Lys ratio of 0.24 were most
efficient
C
-reactive protein levels suggested a minimal inflammatory challenge
occurred
Despite lack of disease/challenge (no mortality, 2.5% removals),
D
ata suggests that optimum SID
Trp:Lys
for production lies
above
current NRC recommendation of 0.16In agreement with other studies
Slide20Economic model for determining SID Trp:Lys levels in diets (PIC USA)
(http://www.lysine.com/en/tech-info/TrpLys.aspx)
Slide212. Sulphur amino acids
Slide22Immune system activation alters amino acid partitioningSulphur amino acids (
SAA; methionine+cysteine) act as precursors
for
immune
system proteins and
metabolites,
Albumin
(
≈
11% SAA
)
Defensins (≈
40 % CYS
)Polyamines, choline, carnitine
Glutathione (GSH; ≈ 39 % CYS)
SAA can become
deficient when immune system is activated
During immune system activation, SAA are preferentially preserved or repartitioned in favour of non-protein compounds such as
glutathione
Slide23Sulphur amino acids for weaner pigs
Current NRC recommendations (2012),7-11 kg BW recommended level of SID
SAA:Lys
and
Met:SAA
are
0.56
and
0.51
, respectively
11-25 kg BW recommended level of SID SAA:Lys and Met:SAA
are 0.55 and 0.52, respectivelyCysteine (Cys
) can contribute to 50% of the requirement for Met
Inflammatory conditions after
weaning (stress, infection) may generate
additional
specific requirements for SAA
Slide24Aims and HypothesesAim:
Determine optimum SID SAA:Lys ratio in weaner pigs infected with enterotoxigenic E. coli (ETEC)
Hypotheses
:
ETEC challenge will increase the requirement for SAA
Pigs fed higher SAA will have better production than those fed lower levels of SAA
Slide25Methods
Treatment No.SAA ratios and infection status1
0.45 SID
SAA:Lys
+ Infection
2
0.55
SID
SAA:Lys
+ Infection
(NRC 2012 level)
30.62 SID SAA:Lys + Infection
4
0.70 SID SAA:Lys + Infection5
0.78 SID SAA:Lys + Infection60.55 SID
SAA:Lys (No infection)
(NRC 2012 level)Pigs allocated to the following six treatments (total 120 Topigs
pigs) according to: (i) body weight
(ii) sex (1:1) and
(iii) F4 genotype (RR:RS = 13:7)[Data
for treatments 2 and 6 combined due to both groups succumbing to oedema disease]
Slide26Methods
Day
0
6
7
8
9
10
15
20
22
29
36
Housing
Group housing
Individual Housing
Diet*
Phase 1: NE
10.25 MJ/kg, CP 209 g/kg and SID Lys of 11.7 g/kg
Phase 2
: NE 10.25 MJ/kg, CP 199 g/kg and SID Lys 10.77 g/kg
Infection**
✓
✓
✓
Bleed
✓
✓
✓
Diarrhoea
Assessment**
Daily
Weigh
✓
✓
✓
✓
✓
✓* Standard diet was adjusted with synthetic DL methionine, SID Lys was 90% of NRC 2012 value (restricted), SID Trp:Lys = 0.22 for all diets, SID Thr:Lys = 0.64 for all diets **Infected with ETEC (5 mL, 1.13 x 10⁸ CFU/mL, serotype O149:K91:K88) on d 8, 9 and 10 after weaning
Slide27Faecal consistency score (pre and post-ETEC infection)
Faecal
consistency was assessed on a four-point scale with scores;
0
=
solid, 1=soft, 2=sloppy,
and
3=liquid,
and then converted
to percentage values
0=0%, 1=33.33%, 2=66.67%, and 3=100
%(Capozzalo et al
., 2014; J. Anim. Sci.
92 (Supplement 2):091)
Slide28Estimation of optimum SID SAA:Lys level for daily gain in pigs 8-20 kg BW
(quadratic broken-line model; R2=0.94)
(
Capozzalo
, 2015; PhD Thesis, Murdoch University)
NRC (2012)
Current study
Slide29Estimation of optimum SID SAA:Lys level for feed intake in pigs 8-20 kg BW (quadratic broken-line model; R
2=0.97)
(
Capozzalo
, 2015; PhD Thesis, Murdoch University)
NRC (2012)
Current study
Slide30Estimation of optimum SID SAA:Lys level for gain:feed in pigs 8-20 kg BW (quadratic broken-line model; R
2=0.90)(Capozzalo
, 2015; PhD Thesis, Murdoch University)
NRC (2012)
Current study
Slide31Main conclusions from this study(pigs 8-20 kg BW) No
significant dietary effects of SID SAA:Lys on days with diarrhea (faecal consistency) or shedding of F4 ETEC
Overall daily
gain
optimised
at ≈
0.71
SID
SAA:Lys
, while SID
SAA:Lys of ≈ 0.73 optimised
feed intakeOverall G:F optimised
at
≈ 0.68 SID SAA:Lys Oedema disease kills pigs
Slide32Commercial study
Performance of commercial grow-finish pigs (48-100 kg): daily gain
Experimental studies
(
SAA:Lys
ratios
of
0.45
, 0.50,
0.55
, 0.60, 0.65, 0.70, 0.75 and 0.80)
(Kim et al., 2015;
Anim. Prod. Sci.
55
:
1564)
Slide33Performance of commercial grow-finish pigs (48-100 kg): carcass weight
Commercial study
Experimental studies
(
SAA:Lys
ratios
of
0.45
, 0.50,
0.55
, 0.60, 0.65, 0.70, 0.75 and 0.80)
(Kim et al., 2015;
Anim. Prod. Sci.
55
:
1564)
Slide34Overall conclusionsImmunonutrition – feeding (selected) essential/conditionally essential amino acids at targeted times of the production cycle
We, and others, shown that the production optimum for SID Trp and SAA (to Lys) levels in weaner pigs lies above currently recommended levels (e.g., NRC, 2012), even in the absence of disease
challenge
Implications for grow-finish pigs
Need to determine the
economic optimum
Slide35Slide36IDO is activated during inflammation and helps create conditions that favor immune suppression and tolerance
(Munn and Mellor, 2013; Trends Immunol. 34:
137-143)
Slide37Metabolic control of T cell and Treg responses via IDO
(Munn and Mellor, 2013; Trends Immunol. 34: 137-143)
KYN release
and TRP consumption
by
accessory cells expressing
IDO
generates
signals
that have profound effects on
T
cell and Treg responses to inflammatory and antigenic signals
Slide38Immune system
activation (e.g.,
through
poor
sanitation
)
decreases
growth
efficiency
(
Pastorelli et al., 2012;
Animal 6:952–961)