

Brassica removal Riley T Pratt Stephanie N Kivlin Jessica D Pratt Margaret B Royall Jennifer M Talbot Orange County Society for Conservation Biology Speaker Seminar Series Field Trips ID: 933350
Download Presentation The PPT/PDF document "Plant and fungal community responses to ..." is the property of its rightful owner. Permission is granted to download and print the materials on this web site for personal, non-commercial use only, and to display it on your personal computer provided you do not modify the materials and that you retain all copyright notices contained in the materials. By downloading content from our website, you accept the terms of this agreement.


Slide1
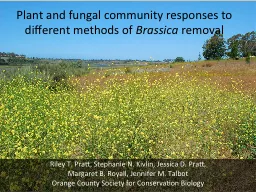
Plant and fungal community responses to different methods of
Brassica removal
Riley T. Pratt, Stephanie N. Kivlin, Jessica D. Pratt,
Margaret B. Royall, Jennifer M. Talbot
Orange County Society for Conservation Biology
Slide2Speaker Seminar Series
Field Trips
Restoration Projects & Research
www.ocscb.org
Slide3Upper Newport Bay Ecological Reserve: 752 Acres
Slide44.8 ACRE SLOPE
COASTAL SAGE SCRUB
NATIVE GRASSLAND
INVASIVES: BRASSICA AND ERODIUM SPP.
Slide5Slide6Effects of
Brassica Invasion on Ecosystems
Alter structure and composition of coastal sage scrub (CSS)
Disrupt native fungal communities on which many CSS plant species depend
Slide7Establishing experimental Brassica removal plots
4 treatments x 4 reps. = 16 plots
Treatments:
Herbicide (2% glyphosate)
Mow
Hand-weed
Control
Treatments applied in Mar & Dec 2009 and Dec 2010
Responses Measured (Spring 2010-2012):
Percent cover of all plant species
Fungal hyphal length in soil
Slide8Research Questions
How do different methods of Brassica removal impact:
Cover
of
Brassica species?Overall cover of native and exotic vegetation?
Plant species composition?Fungal biomass in soil?
Slide9March 2010: Handweeding suppresses Brassica and promotes native plant cover more than controls
Native cover: F
3,15
= 3.93, P=0.036;
Brassica
cover : F
3,15 = 8.13, P = 0.003; Non-Brassica exotic cover: F3,15 = 11.65, P < 0.001
Removal Treatments
Slide10Mowing & handweeding ↓
Brassica and ↑ the native
Deindandra fasiculata
MRPP T = -7.74, A=0.415, P < 0.0001
Removal Treatments
Slide11F
3,15
= 3.343, P = 0.038
Brassica
removal increases fungal biomass
Removal Treatments
Slide12March 2011: Handweeding suppresses Brassica and promotes native plant cover more than controls
Native cover: F
3,15
= 0.8, P=0.511;
Brassica
cover : F
3,15 = 2.22, P = 0.138; Non-Brassica exotic cover: F3,15 = 4.29, P =0.028
Removal Treatments
Slide13January 2012: Handweeding suppresses Brassica and promotes native plant cover more than controls
Native cover: F
3,15
= 0.13, P=0.9397;
Brassica
cover : F
3,15 = 7.2, P = 0.005; Non-Brassica exotic cover: F3,15 = 7.86, P =0.004
Removal Treatments
Slide14Summary
Herbicide
Reduced all plant cover types initially but currently has the highest cover of
Brassica
Initially increased soil fungi compared to the control
Mowing
Did not affect
Brassica
, native, or exotic plant coverResulted in the greatest initial increase of soil fungi
Hand-weeding
Most effectively reduced
Brassica
cover and increased native plant cover.
Initially increased soil fungi compared to the control
Slide15Is hand-weeding worth the effort?
Slide16Acknowledgements
Research, design, data collection
: Steve Allison, Bob Reed, Kathleen Treseder, and Numerous OCSCB volunteers
Collaborators
: Matt Yurko (CCC), Jeff Stoddard (DFG), County of Orange Park and Rec
Funding
: Sonoran Joint Venture Foundation, Newport Bay Conservancy
www.ocscb.org
Slide17Soil fungi increase when soil nitrate declines
Soil hyphal length (mm/g dry soil)
% Change in soil NO
3
-
after 1 month
No treatment
Herbicide
Hand-weeding
Mowing
Slide18No treatment
Herbicide
Mowed
Hand-weeded
% Change in soil NO
3
-
after 1 month
Slide19Pre-treatment
1 month
3 months
No treatment
Herbicide
Mowed
Hand-weeded
Soil NO
3
-
(ug N/g soil)