
Rini Mukhopadhyay 1 Vicki McCracken 1 Joan Ellis 2 WSU School of Economic Sciences 1 WSU Department of Apparel Merchandising Design and Textiles 2 Funded by CAHNRS Undergraduate Research and Creative Projects Grant ID: 933166
Download Presentation The PPT/PDF document "WILLINGNESS TO PAY FOR ORGANICALLY PRODU..." is the property of its rightful owner. Permission is granted to download and print the materials on this web site for personal, non-commercial use only, and to display it on your personal computer provided you do not modify the materials and that you retain all copyright notices contained in the materials. By downloading content from our website, you accept the terms of this agreement.


Slide1
WILLINGNESS TO PAY FOR ORGANICALLY PRODUCED AND FUNCTIONAL FOODS
Rini
Mukhopadhyay
1
, Vicki McCracken
1, Joan Ellis2
WSU School of Economic Sciences1 WSU Department of Apparel Merchandising, Design and Textiles2 Funded by CAHNRS Undergraduate Research and Creative Projects Grant
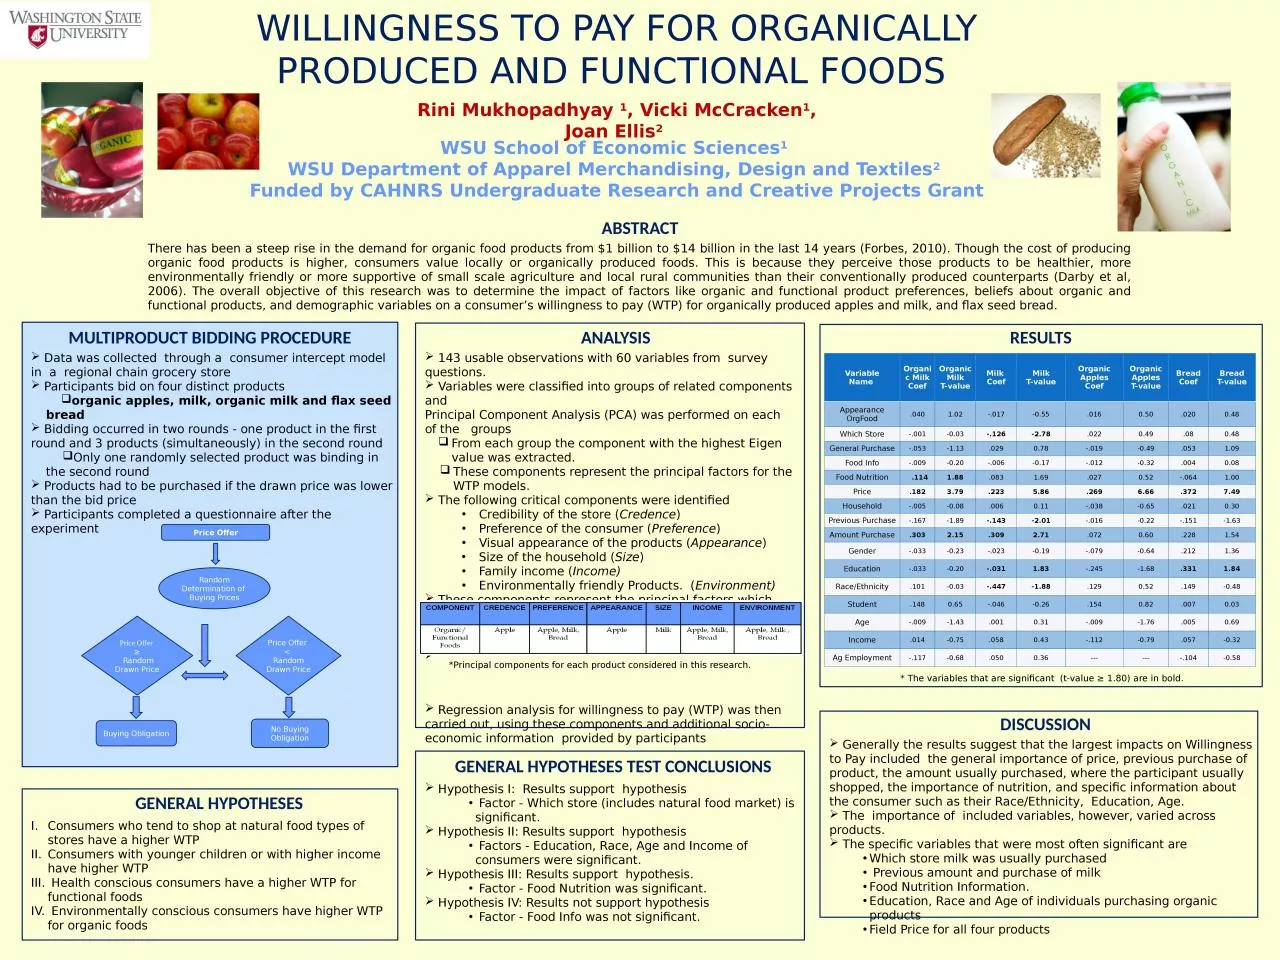
There has been a steep rise in the demand for organic food products from $1 billion to $14 billion in the last 14 years (Forbes, 2010). Though the cost of producing organic food products is higher, consumers value locally or organically produced foods. This is because they perceive those products to be healthier, more environmentally friendly or more supportive of small scale agriculture and local rural communities than their conventionally produced counterparts (Darby et al, 2006). The overall objective of this research was to determine the impact of factors like organic and functional product preferences, beliefs about organic and functional products, and demographic variables on a consumer’s willingness to pay (WTP) for organically produced apples and milk, and flax seed bread.
ABSTRACT
Data was collected through a consumer intercept model in a regional chain grocery store Participants bid on four distinct productsorganic apples, milk, organic milk and flax seed bread Bidding occurred in two rounds - one product in the first round and 3 products (simultaneously) in the second roundOnly one randomly selected product was binding in the second round Products had to be purchased if the drawn price was lower than the bid price Participants completed a questionnaire after the experiment
MULTIPRODUCT BIDDING PROCEDURE
Price Offer
Random Determination of Buying Prices
Price Offer
≥
Random Drawn Price
Price Offer
< Random Drawn Price
Buying Obligation
No Buying Obligation
GENERAL HYPOTHESES
Consumers who tend to shop at natural food types of stores have a higher WTPConsumers with younger children or with higher income have higher WTP Health conscious consumers have a higher WTP for functional foods Environmentally conscious consumers have higher WTP for organic foods
ANALYSIS
143 usable observations with 60 variables from survey questions. Variables were classified into groups of related components and Principal Component Analysis (PCA) was performed on each of the groups From each group the component with the highest Eigen value was extracted.These components represent the principal factors for the WTP models. The following critical components were identified Credibility of the store (Credence) Preference of the consumer (Preference) Visual appearance of the products (Appearance) Size of the household (Size) Family income (Income) Environmentally friendly Products. (Environment) These components represent the principal factors which may influence WTP: Regression analysis for willingness to pay (WTP) was then carried out, using these components and additional socio-economic information provided by participants
RESULTS
* The variables that are significant (t-value ≥ 1.80) are in bold.
GENERAL HYPOTHESES TEST CONCLUSIONS Hypothesis I: Results support hypothesis Factor - Which store (includes natural food market) is significant. Hypothesis II: Results support hypothesis Factors - Education, Race, Age and Income of consumers were significant. Hypothesis III: Results support hypothesis. Factor - Food Nutrition was significant. Hypothesis IV: Results not support hypothesis Factor - Food Info was not significant...
*Principal components for each product considered in this research.
Generally the results suggest that the largest impacts on Willingness to Pay included the general importance of price, previous purchase of product, the amount usually purchased, where the participant usually shopped, the importance of nutrition, and specific information about the consumer such as their Race/Ethnicity, Education, Age.
The importance of included variables, however, varied across products.
The specific variables that were most often significant areWhich store milk was usually purchased Previous amount and purchase of milkFood Nutrition Information.Education, Race and Age of individuals purchasing organic productsField Price for all four products
Variable
Name Organic MilkCoefOrganic MilkT-valueMilk CoefMilkT-valueOrganic ApplesCoefOrganicApplesT-valueBreadCoefBreadT-valueAppearanceOrgFood.0401.02-.017-0.55.0160.50.0200.48Which Store-.001-0.03-.126-2.78.0220.49.080.48General Purchase-.053-1.13.0290.78-.019-0.49.0531.09Food Info-.009-0.20-.006-0.17-.012-0.32.0040.08Food Nutrition .1141.88.0831.69.0270.52-.0641.00Price.1823.79.2235.86.2696.66.3727.49Household-.005-0.08.0060.11-.038-0.65.0210.30Previous Purchase-.167-1.89-.143-2.01-.016-0.22-.151-1.63Amount Purchase.3032.15.3092.71.0720.60.2281.54Gender-.033-0.23-.023-0.19-.079-0.64.2121.36Education-.033-0.20-.0311.83-.245-1.68.3311.84Race/Ethnicity.101-0.03-.447-1.88.1290.52.149-0.48Student.1480.65-.046-0.26.1540.82.0070.03Age-.009-1.43.0010.31-.009-1.76.0050.69Income.014-0.75.0580.43-.112-0.79.057-0.32Ag Employment-.117-0.68.0500.36-------.104-0.58
DISCUSSION