

Tori Turkington Cinzia Ballantyne Jordan Mattheisen Caroline Martel The Kidney R emoves waste products from the body M aintains homeostasis electrolyte levels acidbasebalance ID: 935564
Download Presentation The PPT/PDF document "Mathematical Biology: Modeling the Renal..." is the property of its rightful owner. Permission is granted to download and print the materials on this web site for personal, non-commercial use only, and to display it on your personal computer provided you do not modify the materials and that you retain all copyright notices contained in the materials. By downloading content from our website, you accept the terms of this agreement.


Slide1
Mathematical Biology:Modeling the Renal System
Tori
Turkington
Cinzia
Ballantyne
Jordan
Mattheisen
Caroline Martel
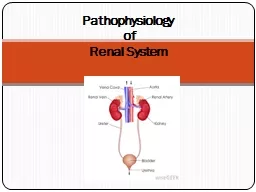
Slide2The Kidney
R
emoves
waste products from the bodyMaintains homeostasis:electrolyte levelsacid/base/balancesalt/water balance
Slide3The Nephron
R
esponsible
for filtering water, wastes, and Na/KRedistributes substancesEach kidney has about 1 million nephrons
Slide4The Nephron
Slide5Dynamics of Sodium and Water Transport Along Renal Tubules
=
distance along the tubule
=
concentration of the sodium ion inside the tubule at position x
=
flow of water (volume per unit time) along tubule at x in the direction of increasing x
=
outward transport of water (volume per unit time per length of tubule) across the walls of the tubule
=
outward transport of sodium ions (number of ions per unit time per length of tubule) across the walls of the tubule
=
distance along the tubule=concentration of the sodium ion inside the tubule at position x=flow of water (volume per unit time) along tubule at x in the direction of increasing x=outward transport of water (volume per unit time per length of tubule) across the walls of the tubule=outward transport of sodium ions (number of ions per unit time per length of tubule) across the walls of the tubule
Slide6Flow through the tubule is steadyF
low
into the segment must equal the sum of the flow out of the segment and the flux of water out through the walls of the
tubule
(2.1)
(2.1)
D
ifferentiate
with respect to
(2.2)
(2.2)
(2.3)(2.3)
Slide7Now, let sodium concentration in the tubule be
S
odium
ion per unit time transported along the tubule by the flow past the point is
(2.4)
(2.4)
Slide8Loop of Henle
=
concentration of sodium
ion
=
water
flow in the
tubules
= external
concentration of sodium
ionLet the flow be positive in the descending limb and negative in the ascending limb.
Slide9Assumptions:1.
the walls
of the descending limb are permeable to water but not to sodium
ions
(3.3)
(3.3)
(3.1)
(3.2)
(3.1)
(3.2)
permeability to water is
>>> that
the flux makes the internal and external concentrations of sodium ion equal2. sodium ions are pumped from the ascending limb at a steady rate per unit time ascending limb is
impermeable to
water
(3.4)
(3.5)
Slide10Assumptions:
3.
At the turn in the Loop
all sodium ions and water leaving the descending limb enter the ascending limb
(3.6)
(3.7)
(3.6)
(3.7)
4.
peritubular
capillaries pick up sodium ions and water locally
driving force for the reverse filtration due to oncotic pressureThe flux of sodium ions and the flow of water is related by the equation:(3.8)(3.8)
Slide11Differential equation for c(x):
From these we derive the following:
(3.9)
(3.10)
(3.9)
(3.10)
Slide12The ratio of fluxes is renamed as α
α determines the maximum
sodium ion concentrating ability of the nephron
through
(3.16)
(3.16)
(3.17)
(3.17)
(3.15)
(3.15)
Slide13Considering the ascending limb:
(3.19)
(3.19)
Rearranging the equation 3.5 we get 3.19
It follows that
(3.20)
(3.20)
Because
=
)
(3.21)
(3.21)
(3.22)
(3.22)
(3.23)
(3.23)
Slide14Juxtaglomerular Apparatus Physiology
=
concentration
of sodium in the filtrate as it leaves the afferent arteriole
=
concentration of sodium sought by the juxtaglomerular apparatus
=
concentration
of sodium in the filtrate as it leaves the afferent arteriole
=
concentration of sodium sought by the juxtaglomerular apparatus
Define:Marieb, E. (2006). Essentials of human anatomy & physiology (8th ed.). San Francisco: Pearson/Benjamin Cummings.
Slide15Juxtaglomerular Apparatus
(4.1)
(4.2)
(4.1)
(4.2)
Assume the following:
(4.3)
(4.4)
(4.5)
(4.3)
(4.4)
(4.5)
Recall:
(3.23)
Recall:
(3.23)
Therefore:
Slide16Juxtaglomerular Apparatus
(4.8)
(4.9)
(4.10)
(4.11)
(4.8)
(4.9)
(4.10)
(4.11)
(4.6)
(4.7)
(4.6)
(4.7)
For small values of a:
Recall:
(4.3)
Recall:
(4.3)
Now we re-write previous section’s conclusions with the parameter c*
Slide17Juxtaglomerular Apparatus99%:1%
reabsorption: error in reabsorption ratio
http
://www.secretlyhealthy.com/wp-content/uploads/2015/06/Dehydration.png
Slide18The Distal Tubule and Collecting duct
(
Moyes
, Schulte, 2015)
Slide19Function of the Distal Tubule and Collecting ductControls concentration of solutes in urine
Process aided by ADH (antidiuretic hormone)
ADH allows distal tubules and collecting duct to be permeable to water
(Andrew Biology, 2011)
Slide20Flux of Na+ and fluid
When ADH is present Na
+
flux at the end of the collecting loop is modeled by:
When ADH is present fluid flux can be modeled by:
(McGraw Hill, 2014)
Slide21Citations
Hoppensteadt
, F., &
Peskin, C. (2002). Modeling and simulation in medicine and the life sciences(2nd ed.). New York: Springer.
Labeled
Diagram of Nephron. (2014, April 4). Retrieved December 11, 2015, from http://
www.buzzle.com/articles/labeled-diagram-of-nephron.html
Marieb
, E. (2006). Essentials of human anatomy & physiology (8th ed.). San Francisco: Pearson/Benjamin
Cummings.
Secretly Healthy. (2015, June 11). Why Dehydration is Making You Fat. Retrieved from http
://www.secretlyhealthy.com/wp-content/uploads/2015/06/Dehydration.png