
Page 1 Removal of waste 1700 X 100 2500 68 Topic 6 Role of the kidneys in homeostasis Page 1 The salts enter urine excreted some are reabsorbed Concentration increases Because water intake lower ID: 931843
Download Presentation The PPT/PDF document "Topic 6 – Role of the kidneys in homeo..." is the property of its rightful owner. Permission is granted to download and print the materials on this web site for personal, non-commercial use only, and to display it on your personal computer provided you do not modify the materials and that you retain all copyright notices contained in the materials. By downloading content from our website, you accept the terms of this agreement.


Slide1
Topic 6 – Role of the kidneys in homeostasis
Page 1
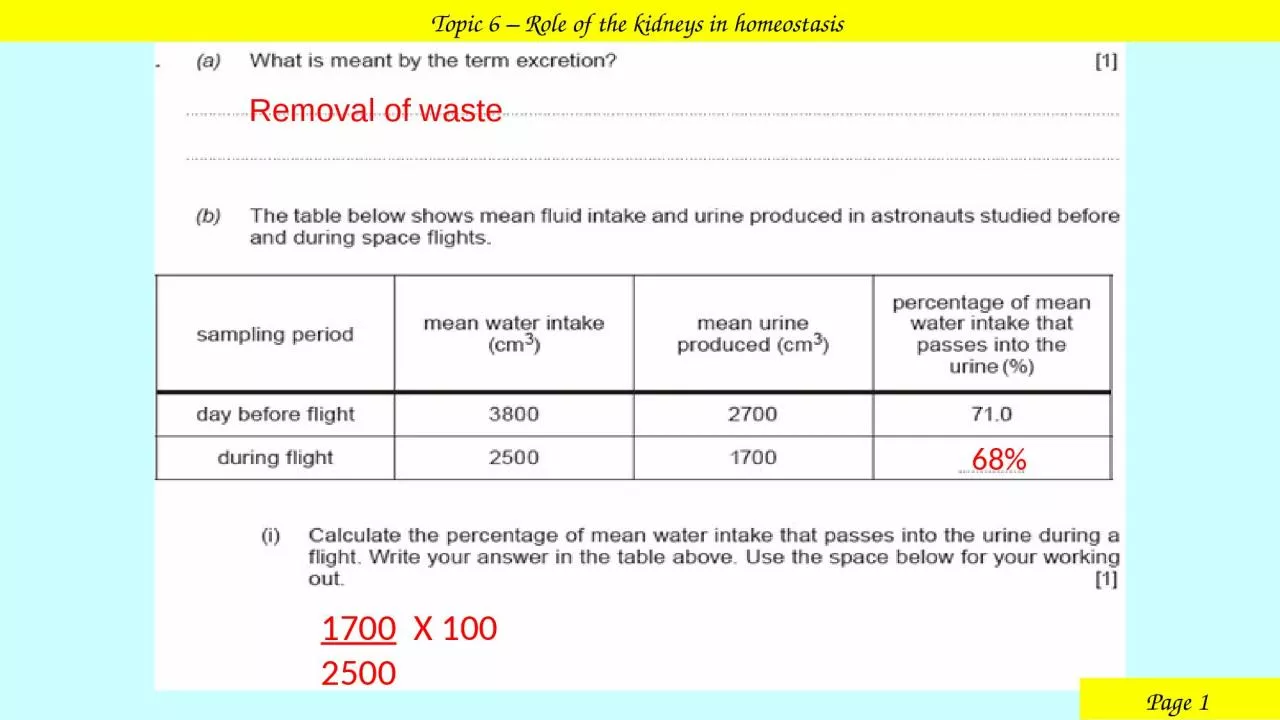
Removal of waste
1700
X 100 2500
68%
Slide2Topic 6 – Role of the kidneys in homeostasis
Page 1
The salts enter urine/ excreted/ some are reabsorbed;
Concentration increases
Because water intake lower
and
percentage of intake that
passes into urine is lower’/ because the volume of urine is
lower
Restore (normal) levels/ return to normal/ replenish salts
Slide3Topic 6 – Role of the kidneys in homeostasis
Page 2
2. The diagram below shows the excretory system of the human body.
From the diagram above, complete the table below (3)
B
D
Urine to bladder
urethra
bladder
{stores/holds} urine
(excess) water
salt(s)
urea
Increased/ becomes stronger/ gets higher;
Slide4Topic 6 – Ultrafiltration
The diagram below shows a kidney tubule
Bowman’s
capsule
collecting
duct
urine
Too large to pass through the semi-permeable membrane during ultrafiltration.
Page 3
Creates an increase in pressure [1]
Ultrafiltration [1]
Slide5Topic 6 – Ultrafiltration
B
C
Page 3
Slide6Topic 6 – Ultrafiltration
Page 4
125
x 100
700
18
Creates an increase in pressure [1]
Ultrafiltration [1]
Slide7Topic 6 – ADH
1. The diagram shows some of the processes which control the composition of blood and urine.
Decrease in water in blood / low water concentration in blood
More water reabsorbed into the blood capillaries [1]
Increased concentration of urine [1]
Page 4
Slide8Topic 6 – ADH
Page 5
2. Explain how anti-diuretic hormone (ADH) helps the kidneys regulate the water content of the blood. [6]
The brain monitors whether there is too much or too little water in the blood.
Too much water means little ADH is released.
Dilute urine is excreted because the kidney tubules do not absorb much water to pass it back to the blood.
Too little water in the blood means more ADH is released.
This causes more concentrated urine to be excreted
because the kidney tubules absorb a lot of water and pass it into the blood
Slide9Topic 6 – Dialysis
Page 6
When the kidneys fail to function, treatment may be necessary using a kidney dialysis machine. The flow diagram below outlines a procedure of kidney dialysis.
Stage 1
Blood from the body enters a dialysis machine from tube X at high pressure as shown in the diagram.
Stage 2
Blood flow in the machine is controlled by a pump and a substance is added to prevent blood clotting.
Stage 3
Blood is bathed in dialysis fluid as shown in the diagram.
Stage 4
Blood returns to the body from the dialysis machine
via tube Y as shown in the diagram below.
(
i
) What blood vessels in the body are equivalent to tubes X and Y shown in the diagram on the left?
X =
y =
Renal vein
Renal artery
Slide10Topic 6 – Dialysis
(ii) Suggest why it is necessary to prevent blood clotting in stage 2.
(iii) State the process by which molecules, other than water, will filter from the blood into the dialysis fluid.
(iii)State the process by which molecules, other than water, will filter from the blood into the dialysis fluid.
(iv) Suggest why the blood and the dialysis fluid re flowing in opposite directions in stage 3.
(b) What other treatment might a person have if their kidneys fail to function?
Prevent blockage / blood clot would stop flow
Prevent blockage / blood clot would stop flow
Diffusion
Maintain concentration gradient
Kidney transplant
Page 6
Slide11Page 6
Topic 6 – Dialysis
The apparatus shown below was set up to investigate the permeability of a newly invented dialysis tubing used in renal dialysis machine. A chemical dye was used which changes from colourless to blue in the presence of urea.
Which part of the diagram represent:
(
i
) Dialysis fluid in a dialysis machine?
(ii) Blood in a dialysis machine?
(ii) The apparatus was left for 40 minutes. During this time the dye changes to blue but the solution within the dialysis tubing remained colourless.
What two conclusions can you make from these observations?
Chemical dye
Urea solution
Urea is able to diffuse through the new dialysis tubing
Chemical dye is not able to diffuse through the new dialysis tubing
Slide12Topic 6 – Transplants
Page 7
1 (a) Complete the sentence.
The kidneys remove waste products in a process called
The table below compares the success rate of some transplant operations.
(b) When a human organ fails to function doctors can carry out a transplant operation using an organ from a donor. The transplant is said to be successful if the transplanted organ functions normally for at least one year.
Type of transplant
Success rate (%)
Year when doctors first started transplants
Number of years doctors have been doing transplants (up to 2014)
Kidney (family donor)
98
1960
54
Kidney (non-family donor)
87
1960
54
Lung
77
1986
Heart
85
1975
Liver
84
1983
31
28
39
excretion
Complete the table by writing your answers on the dotted lines.
Slide13Topic 6 – Transplants
Type of transplant
Success rate (%)
Year when doctors first started transplants
Number of years doctors have been doing transplants (up to 2014)
Kidney (family donor)
98
1960
54
Kidney (non-family donor)
87
1960
54
Lung
77
1986
28
Heart
85
1975
39
Liver
84
198331
Kidney (FD)
Kidney (NFD)
Liver
Lungs
Heart
(ii) Complete the bar chart below by adding the bars for kidneys, liver and lung.
Place the bars in order from the most to the least successful and label them.
(iii) Use only information in the table and the bar chart to suggest a reason why the success rates for the various transplant operations are different.
Some operations have been performed for longer
Type of transplant
(iii) From your own knowledge, explain why a kidney transplant is more likely to be successful when the donor is a family member.
Less likely to be rejected [1] ;
as similar/compatible tissue type [1]
Slide14Homework Topic 6 – The kidney
The presence of protein in the urine is a symptom of a kidney disease called nephrotic syndrome. The drug endaravone is used as a treatment for this disease. Rats with nephrotic syndrome were used to investigate the effects of
endaravone. A control group of healthy rats was also used in the investigation. The results are shown in the table:
Group of rats
Protein
in urine (mg/day/rat)
Control
0
With nephrotic syndrome
350
After treatment with
endaravone
0.5
(a) (
i
) What was the purpose of the control group? [1]
To offer a comparison / to show that without nephrotic syndrome there is no protein in urine
(ii) Give a reason for the absence of protein in the urine of rats which do not show nephrotic syndrome (control group). [1]
Protein molecules are too large to fit through pores in the semipermeable membrane of the capillary knot during ultrafiltration
(B) State three factors which must be kept the same in this investigation. [3]
Amount of
endaravone
drug used / concentration of drug used
Same species of rat
Same age of rat
Same food given to rats
Slide15Homework Topic 6 – The kidney
(c) How would you increase the strength of this investigation? [1]
Repeat the experiment 3 times and calculate an average. (c) How does this evidence suggest that endaravone might be useful in the treatment of nephrotic syndrome in humans but it is not a cure? [2]
Treatment as it significantly reduces the amount of protein in urine (to 0.5mg/day).
Not a cure as there is still a small amount (0.5mg/day) of protein in the urine.
Slide16Homework Topic 6 – The kidney
2. The diagram shows a simplified summary of what happens in a human kidney which is diseased and does not function correctly.
Ureter (spelling)
Concentration
of substances in blood entering kidney (g per L) Protein
75.0
Urea
0.5
Glucose
1.0
Salt
9.0
Concentration
of substances in urine (g per L)
Protein
10
Urea
40
Glucose
1.0
Salt
12.0
Name A
B
C
renal vein
renal artery
(C) Explain why the concentrations of urea and salt are higher in urine than in the blood. [2]
Presence of protein in urine
Presence of glucose in urine
Water has been reabsorbed/removed
(b) What two pieces of evidence in the boxes suggest that the person’s kidney is not working properly? [2]
Into the blood
Slide17Homework Topic 6 – The kidney
(d) A diseased kidney may be replaced by a healthy one by transplanting one from a donor to a recipient. State the most important precaution that has to be takenBefore the transplant takes place; [1]
(ii) After the transplant takes place and the surgery has been completed [1]
Correct tissue match/typeAnti-rejection/immunosuppressant drugs
Slide18Topic 7 – Microorganisms and their application
1. (a) The series of diagrams below, labelled A-D, show the stages in the aseptic techniques involved in inoculating and plating bacteria from milk samples. The stages shown are not in the correct order.
Place the stages in order by underlining the correct sequence of events. [1]
A C D B
B A D C B C D AD A B C
(ii) Give a reason why the Petri dish is sealed in stage C. [1]
To prevent {entry / exit} of bacteria/ contamination by bacteria
Slide19Topic 7 – Aseptic technique
(b) Students kept fresh pasteurised milk at three different temperatures for five days. At the end of this time they spread the milk samples onto sterile agar plates, which were then incubated 25oC. After three days incubation the agar plates were examined. The results are shown below.
(ii) Each of the colonies of bacteria on the agar plates is made up of many thousands of bacteria. How many bacteria were in the original milk sample spread onto plate 2? [1]
10
o
C
4
o
C
35
o
C
7
(
i
) Using temperatures from the list below, complete the table above by inserting the most likely temperature at which the milk was kept for the five days before the milk was spread onto the agar. [3]
(iii) Explain the possible consequences to this investigation if stage B (flaming wire loop) had not been carried out [2].
bacteria on the inoculating loop would not have been killed/ loop would not have been sterilised;
therefore the agar would have {bacteria/ micro-organisms} growing on it which would have not come from the milk/ contaminated with bacteria not from the milk;
Slide20Topic 7 – Aseptic technique
2. Some fresh meat was cut into three 100g pieces. Each 100g piece of meat was stored at a different temperature for 14 days. The three temperatures used were:
-20oC (the temperature at which food is stored in a domestic deep freeze)
30C (the temperature at which food is stored in a domestic refrigerator) 25oCAfter 14 days, meat samples of equal mass from each temperature were inoculated onto agar jelly in Petri dishes. Aseptic techniques were used throughout the investigation.
(i) State one conclusion which can be drawn from the results of this investigation. [1]
Three Petri dishes were then kept in an incubator for three days at a temperature of 30
o
C. At the end of this period the Petri dishes were removed from the incubator and examined. The results are shown below.
More colonies of bacteria are formed at higher temperatures
(ii) Each of the colonies consists of many thousands of bacteria.
I How many bacterial cells were spread onto the agar which was inoculated with meat stored at -20
o
C?
8
Slide21Topic 7 – Aseptic technique
At -20°C bacteria do not multiply/reproduce/ grow; [1]
To prevent contamination of the {agar/ jelly}/ to make sure that the bacteria growifng on the {agar/ jelly} came from the meat only (OWTTE);
(a) II Explain the advantage of storing meat at -20oC. [2] therefore meat is preserved/doesn’t go off; [1]
(B) (i) Why were aseptic techniques used throughout this investigation? [2] (B) (iii) Give one example of aseptic technique which would have been used during the investigation. [1]
Flame wire loop / sterilisation of agar / sterilisation of equipment / correct sealing of Petri dish / disinfect work area
Slide22Topic 7 – Aseptic technique
3. Describe how you would carry out an investigation into the number of bacteria present in boiled milk and milk that had been left at room temperature for five days using a basic technique and agar plates. In your description, state the expected results. [6 WER].
Aseptic collection of milk samples. Flame loop.
Inoculating and plating samples on separate plates. Sealing Petri dishes. Incubation at stated correct temperature (20-25
oC) Stated time (12-24 hours). Count colonies on plate with stale milk.
{No/fewer} {colonies/bacteria} in boiled milk.
Slide23Topic 7 – Microorganisms and their adaptations
1. The diagram below shows a fermenter used to produce the antibiotic penicillin.
(a) Explain why the air entering the fermenter must be sterile. [1]
To prevent entry of microorganisms
(b) From the diagram suggest how the temperature of the fermenter is controlled. [2] Temperature monitor measures temperature. [1]
Adjusts rate of / flow of / temp of cooling water. [1]
(C) (
i
) From the graph suggest what time the penicillin should be removed from the fermenter to obtain the highest yield in the shortest time. [1]
84
(C) (ii) State the name of the organism that produces penicillin. [1]
Penicillium
Slide24Method Sterilise petri dishes and agar jelly by heating to 120o
C for 15 minutesFor each dish, smear the jelly with one of the bacteria using a sterilised incubating loop.Label the dishes A, B, C, D for the different bacteria in them.
Place one pre-soaked disc for each of the antibiotics 1, 2, 3, 4 in each dish. Seal the lids with tape.Mark on each plate the position of each antibiotic.
Incubate for two days at 25oC.
(a) Why were the agar jelly and the petri dishes heated to 120oC? Circle your chosen answer.
To make the nutrients in the jelly dissolve.
To make the bacteria grow faster.
To kill any micro-organisms in the jelly and dishes.
Topic 7 – Microorganisms and their adaptations homework
Slide25(b) Answer True or False, decide which of the following are important control variables in this investigation.
The concentration of the antibiotic
solutions used .
The colour of the agar jelly.
The temperature at which the petri dishes were kept after bacteria were added.
The diameter of the petri dishes.
True
False
True
True
(c) What has happened in the dishes to create “a clear area” in the jelly?
Antibiotics have prevented any growth of bacteria by killing any bacteria that try to grow close to the antibiotic disc.
(d) What has happened in the dishes to create “a clear area” in the jelly?
Measure the distance of the clear area for each antibiotic.
Compare size of clear area for each antibiotic. The antibiotic which produces the largest clear zone is the most effective.
Topic 7 – Microorganisms and their adaptations
Topic 7 – Microorganisms and their adaptations homework
Slide26To prevent contamination from microorganisms other than the ones you wanted to grow in the petri dish.
Topic 7 – Microorganisms and their adaptations
(e) Explain fully why the scientists sealed the dishes before and during incubation. f) Using the scientists’ results, which antibiotic could be used to kill any of the bacteria?.
Clearly explain how you made your decision. Answer: Antibiotic ………………………………Reasons:
2Only antibiotic 2 has a clear zone for bacteria A-D.
Other antibiotics do not work on all bacteria as some had no clear zone on certain plates with certain bacteria .
Topic 7 – Microorganisms and their adaptations homework
Slide27Topic 7 – Microorganisms and their adaptations
Topic 7 – Microorganisms and their adaptations homework
(g) Using the scientists’ results, which antibiotic was equally effective in killing Bacteria B and Bacteria C? Tick your choice.
Antibiotic 3(h) The scientists want to improve the reproducibility of their investigation. Which of the following suggestions would not improve the reproducibility? Tick your choices.
Ignore any results where bacteria were not killed.
Use
larger discs of paper soaked in antibiotic solutions.
Repeat the investigation
using different antibiotic and different bacteria.
Repeat the investigation and calculate the mean clear diameter for each antibiotic.
Calculate the mean clear diameter for all the antibiotics in one petri dish.
Heat the petri dishes containing bacteria to 70
o
C
(Reproducibility - The precision obtained when repeat readings are obtained by a different learners/groups).
Slide28Topic 7 – Microorganisms and their adaptations homework
(i) The scientists want to find the lowest concentration of solution of antibiotic 3 that will work against Bacteria B. Outline an experiment they could perform to do this. You may wish to use fully labelled diagrams to support your answer.
Have discs with a range of concentration of antibiotic ranging from 10 A.U to 0 A.U in intervals of 0.5.
Flame an inoculating loop and allow to cool.Dip inoculating loop into a culture of bacteria B
Place a disc in the centre of a sterilised petri dish containing sterilised agar of each concentration. Incubate the plates at 25oC for 24-48 hours.
Look at the plates and identify which plate with the lowest concentration which still has a zone of clearance. This is therefore the lowest concentration that will still kill bacteria B.
Slide29Topic 7 – Microorganisms and their adaptations homework
A scientist investigated the growth of the bacterium
E.Coli
at different temperatures. The results are shown in the graph below.
From the graph
(
i
) Describe the change in numbers of bacteria from 20-60 hours at 45
o
C. [2]
Between 20-40
o
C the number of bacteria increased (from 150 to 300) (1)
After 40
o
C the temperature remains constant. (1)
270 – 220 (1)
(ii) Calculate the difference in the numbers of bacteria between 28
o
C and 37
o
C at 25 hours. [2]
= 50
(iii) How did increasing the temperature affect the numbers of bacteria present? [2]
Increasing the temperature from 28
o
C to 37
o
C caused the number of bacteria to increase.
Increasing the temperature from 37
o
C to 45
o
C caused the number of bacteria to decrease below the numbers produced at 28
o
C or 37
o
C.
Slide30Topic 7 – Microorganisms and their adaptations homework
(b) After the investigation, another scientist was asked to carry out the same investigation using exactly the same methods and apparatus as the first scientist. Why was this necessary?
To see if the experiment was reproducible.
(c) E.coli in food can cause illness in humans. State why meat must be kept in a refrigerator.
Reduces the growth/reproduction rate of bacteria on food which increases the time before the food goes off.