
in a mature temperate forest under elevated CO 2 Susan Quick SEQ616studentbhamacuk Giulio Curioni Phillip Blaen St e fan Krause A Rob MacKenzie https ID: 932007
Download Presentation The PPT/PDF document "Tree-Soil-Water relations" is the property of its rightful owner. Permission is granted to download and print the materials on this web site for personal, non-commercial use only, and to display it on your personal computer provided you do not modify the materials and that you retain all copyright notices contained in the materials. By downloading content from our website, you accept the terms of this agreement.


Slide1
Tree-Soil-Water relations in a mature temperate forest under elevated CO2 Susan Quick SEQ616@student.bham.ac.uk , Giulio Curioni, Phillip Blaen, Stefan Krause, A. Rob. MacKenzie
https://www.birmingham.ac.uk/research/bifor/face/index.aspx
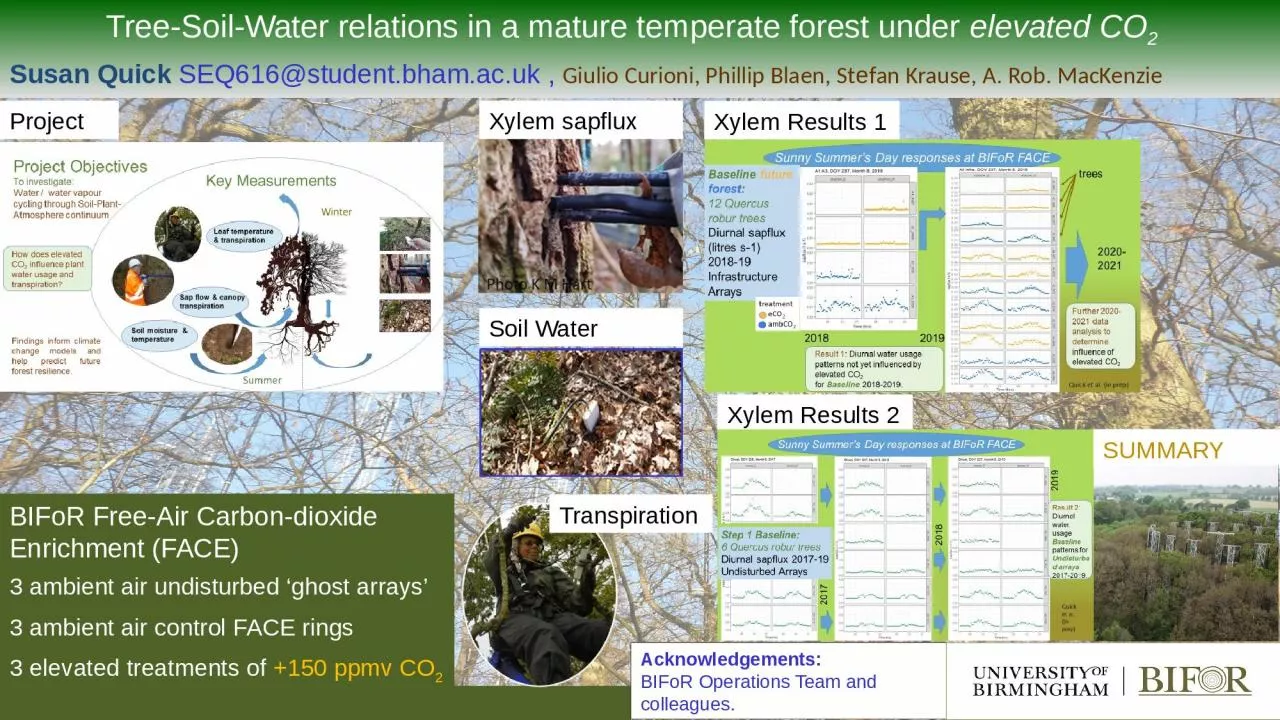
Acknowledgements: BIFoR Operations Team and colleagues.
BIFoR
Free-Air Carbon-dioxide Enrichment (FACE)3 ambient air undisturbed ‘ghost arrays’3 ambient air control FACE rings 3 elevated treatments of +150 ppmv CO2
Project
Xylem
sapflux
Xylem Results 1
Xylem Results 2
Soil Water
SUMMARY
Transpiration
Slide2Project ObjectivesSoil moisture & temperaturePhoto K M Hart
Leaf temperature & transpiration
Sap flow & canopy transpiration
Summer
WinterFindings inform climate change models and help predict future forest resilience.To investigate: Water / water vapour cycling through Soil-Plant-Atmosphere continuum Key MeasurementsHow does elevated
CO
2
influence plant water usage and transpiration
?
Slide3Diurnal & seasonal dataDATA VISUALISATIONPoint Sapflux density mm s-12017- 2019 baseline analysis .Quick et al. (in prep) PLANT-WATER
XYLEM SAPFLOW Quercus robur trees
2 trees in each experimental patch
Confounding factors
tree sizesap speedwood characteristicsxylem widthwounding
Slide4Baseline future forest: 12 Quercus robur treesDiurnal sapflux (litres s-1)2018-19Infrastructure ArraysSunny Summer’s Day responses at BIFoR FACE
20182019
Q:
How does elevated
CO2 influence plant water usage and transpiration?
Result 1:
Diurnal
water usage
patterns not yet influenced by elevated CO
2
f
or
Baseline
2018-2019.
2020- 2021
Further 2020-2021 data analysis to
determine
influence of elevated CO
2
t
reatment
eCO
2
ambCO
2
trees
Quick et al. (in prep)
Slide5Step 2 Paired comparison: 4 Quercus robur treesDiurnal sapflux 2017-19Infrastructure Arrays A1:A3Sunny Summer’s Day responses at BIFoR FACE20172018
2019
Slide6Step 1 Baseline: 6 Quercus robur treesDiurnal sapflux 2017-19Undisturbed ArraysSunny Summer’s Day responses at BIFoR FACE20172018
2019
Quick et al. (in prep)
Result 2:
Diurnal water usage Baseline patterns for Undisturbed arrays 2017-2019.
Slide7tely measure soil moisture (to 100cm depth), soil temperature (surface to 60cm depth) across the 9 research patches and sap-flow for 18 oaks and 3 sycamores20172018drought
SOIL-WATER
SOIL MOISTURE (to 100cm depth) measuredWATER INPUT (precipitation) across the forest strongly influences shallow pore water availability.
Ghosts patches
wetterCO2 arrays, some reduction relative to pre-treatment Overall very heterogeneous
FULL ANALYSIS IN PROGRESS
RESULTS 3
Shallow
(12cm depth)
Volumetric
water content of
soil takes time to recover from dry years.
.
Quick et al. (in prep
)
tely measure soil moisture (to 100cm depth), soil temperature (surface to 60cm depth) across the 9 research patches and sap-flow for 18 oaks and 3 sycamores
2017
2018
drought
SOIL-WATER
SOIL MOISTURE
(10cm to
100cm depth) measured
WATER INPUT (precipitation) across the forest strongly influences shallow pore water availability.
Overall very heterogeneous
eCO
2
arrays,
recovered from 2018 drought
2019
Ghosts patches
wetter
Slide8TRANSPIRATIONSTOMATAL CONDUCTANCE :Rubus fruticosus/ bramble and Quercus robur oaks (2019) - 6 undisturbed trees 4 amb
CO2 trees 4 elevated CO2 trees
)Bramble
Oak top canopy
RESULTS 4Quick et al. (in prep)
Quercus
robur
/
Oak
leaves have more varied leaf temperature effects than
Bramble
FULL ANALYSIS IN PROGRESS
2019
Slide9BIFoR (FACE)2015-16 baseline pre-treatment 2017-2026 eCO2 @BIFoRUoB MacKenzie AR, et al., BIFoR FACE: Water-soil-vegetation-atmosphere research in a temperate deciduous forest catchment, including under elevated CO2, Hydrological Processes, submitted Sept. 2020Hart, et al. (2019
) Characteristics of Free Air Carbon Dioxide Enrichment of a Northern Temperate Mature Forest. Glob Change Biol. doi:10.1111/gcb.14786
Tree-soil-water relations 2017-2019https://www.birmingham.ac.uk/research/bifor/face/index.aspx
SUMMARY
Early sapflux analysis indicates there may be less tree water usage under elevated CO2 treatment but diurnal water usage differences not yet normalized Result 1 & 2 Volumetric water content within O horizon of soil responds to dry years consistently across treatments Result 3 Stomatal conductance/ leaf temperature measurement in process of analysis for 2019 onwards. Result 4Three years of Tree-soil-water data now available, two more year progressing for this study to 2021
– all open access by c2023
.
Thank You for viewing
Quick et al. (in prep)