
with nuclear beta decay Bertram Blank CEN BordeauxGradignan Germanium detector calibration experimental studies 0 0 b decay mirror b decay future ID: 933586
Download Presentation The PPT/PDF document "Weak-interaction studies" is the property of its rightful owner. Permission is granted to download and print the materials on this web site for personal, non-commercial use only, and to display it on your personal computer provided you do not modify the materials and that you retain all copyright notices contained in the materials. By downloading content from our website, you accept the terms of this agreement.


Slide1
Weak-interaction studieswith nuclear beta decay
Bertram Blank
CEN Bordeaux-Gradignan
Germanium detector calibration
experimental studies: 0+ - 0+ b decay mirror b decay future work
Top Row CKM Unitarity WorkshopJanuary 7- 8, 2019The Mitchell Institute, Texas A&M University, College Station, Texas, USA
Slide2Experimental ft measurements
T
1/2
Q
EC
BR
0
+0
+
•
•
•
Nuclear beta decay
in general:
for
0
+
0
+
transitions
: only vector current due to
selection
rules
experimental quantities
: precise measurements of
masses of parent and daughter, half-life, branching
ratio
correct for other interactions: for T=1 many transitions: validate corrections, test CVC, determine Vud matrix element, test CKM matrix unitarity, test scalar contributions…
Slide3Germanium detector calibration
Slide4Super-allowed Fermi transitions for
T
z
= -1
many
decay channels open strong non-analog transitions low decay energies high precision of g efficiency needed
0.1%
Slide5Derel = 0.1%, De
abs
= 0.15%
calibration programme of a
HP Ge detector: - x-ray
photography of detector - scan of the
crystal at CSNSM - source measurements - MC simulations: CYLTRAN, GEANT4•
• • Calibration of germanium detector
Scan at
CSNSM:
137
Cs
strongly
collimated
Relative
detection
efficiency
:
24
Na
,
27
Mg
,
48
Cr
,
56
Co
, 60Co, 66Ga, 75Se, 88Y, (109Cd), 133Ba,
134Cs,
137
Ce, 152
Eu,
169Yb
, 180Hf
, 207Bi
Peak/total: 22
Na, 38K
, 41
Ar
,
51
Cr,
54
Mn,
57
Co,
58
Co
,
60
Co,
65
Zn
,
85
Sr,
137
Cs
…ISOLDE, IPNO sources
X-rayphotography
B.
Blank et al., NIMA776 (2015) 34
…trigger by John’s
work
Slide6• • • Additional c
alibration
of germanium detector: preliminary
Newly added:
38
K,
169Yb, 48Cr 24Na, 48Cr(add. meas.), 207Bi (new analysis)Still to come: 109CdHigher-statistics calculations:
75Se, 133Ba, 137Cs, 152Eu, 180Hf 0.15 % precision for E < 100keV
Slide7• • • Peak-to-total
Slide8• • • Escape peaks
and simulation
Slide9• • • Long-term
stability of
germanium detector
Slide100+ - 0+ b
decay
: 38Ca
Slide11Super-allowed Fermi transitions for
T
z
= -1
many
decay channels open strong non-analog transitions high precision of g efficiency needed 0.1%
Slide12Primary Beam: 40
Ca @
50 MeV/A
Production Target :
natNi 90 m
mLISE3 SpectrometerGANIL / LISE3 experimentsDetection
Set-up
•
•
•
38
Ca production at GANIL/LISE3
10
4
38
Ca / s
99.5 %
purity
Contaminants:
37
K: 0.12 %
36Ar (stable): 0.11 %
35Cl (stable): 0.09 % 34S (stable):
0.14 %
Slide13•
•
•
38Ca branching ratios and half-life
Present work and Anderson et al.B. Blank et al., EPJA 51 (2015) 8
(443.6
3 ± 0
.35)
Slide14•
•
•
38Ca: result
half-life: BR (0+ — 0+): present: 77.09(35) % Park et al.: 77.28(16) % Q value: Eronen et al.: 6612.11(7) keV
ft = 3063.3(62) s Ft = 3077.5(67) s
443.70(25) ms
77.25(15) %
B.
Blank
et al., EPJA 51 (2015) 8
Slide15•
•
•
38
Ca: result…. 14 nucleiBR for all Tz = -1nuclei largest error
Slide160+ - 0+ b
decay
: 30S
Slide17Super-allowed Fermi transitions for
T
z
= -1
Slide18Primary Beam: 32
S @
50 MeV/A
Production Target :
natNi 90
mmLISE3 SpectrometerGANIL / LISE3 experiments
DetectionSet-up• • •
30
S production at GANIL/LISE3
10
4
30
S / s
T
1/2
= 1176.2(16) ms
99.0 %
purity
Contaminants:
29
P: T
1/2
= 4.142(15) s
28Si: stable 27
Al: stable 26Mg: stable
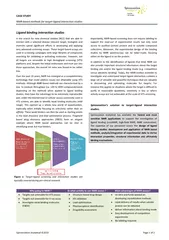
Slide19• • • 30S: very preliminary result
analysis
in
progress
Slide200+ - 0+ b
decay
: 22Mg
Slide21Super-allowed Fermi transitions for
T
z
= -1
Slide22•
•
•
22Mg measurement at ISOLDE
ISOL: lots of
22
Na LIST technique no measurable
22Natrigger - less DAQProton
beam at 1.4 GeV and 2
mATarget: SiC
Source: LIST
Slide23• • • 22Mg: very preliminary result
…
also
data on
branching
ratios
…to be analysed
Slide240+ - 0+ b
decay
: 58Zn
Z
Slide25Implantation set-up
WAS3ABI DSSSD set-up
EURICA
g
-ray array
78Kr at 345 MeV/u with 250 pnA•
•
•
Two
-proton
radioactivity
of
67
Kr at
BigRIPS
/RIKEN
Slide26• • •
Two-proton
radioactivity of 67
Kr at BigRIPS
/RIKEN
A/Z
58ZnZ
Slide27T1/2 = 86(8) ms↓T
1/2
= 84.79(20)
ms
8
(2)
%
72(7)%
58
Zn
58
Cu
<20
%
1
+
848
0
+
1051
203
3257
3460
3474
1
+
0
+
1
+
1
+
T
1/2
= 3.204(7)
s
S
p
=
2873
keV
5.7(1)%
73.10%*
14.4(2)%
0.76(6)%
0.86(7)%
Time (
ms
)
Counts / 1
ms
Data Plot
Fitting Curve
58
Zn Decay Curve
58
Cu Decay Curve
Background
Counts / 2
keV
Gamma Energy (
keV
)
203
848
1051
3257
3473
3460
2747
Branching Ratio
Q
EC
=9364(50)
keV
* This value is assumed
by using the
average
ft
value of
0
+
→
0
+
decays.
Preliminary
511
Previous
Present
•
•
•
Decay
of
58
Zn
at
BigRIPS
/RIKEN
D.
Nishimura
, RCNP Osaka
Slide280+ - 0+ b
decay
: 10C at ISOLDE
Slide29• • • 0+
0
+ decays
: 10
C error budget
BR by far largest error
two precise measurements: Savard et al.: 1.4625(25)% (PRL 74 (1995) 1521) Fujikawa et al.: 1.4665(38)%
(PLB 449 (1999) 6)
measurements with Ge
multi-detector array
our approach:
re-doing the
Fujikawa
/
Savard
experiment by improving
on the systematic errors
Slide30• • •
0
+
0+
decays
: limits on exotic
currents
standard model assumption: only vector current limit on scalar current from term in f function:
(1+bf * g
1 / <E>)
from
b
decay:
b
F
= - 0.0028 ± 0.0026
improve on low-Z nuclei
limit on scalar currents:
b
F
= Re( (C
s
+ C’
s
) /
C
v
) = 0.0026(42) (90% CL)
Severijns
et al.
Hardy &
Towner, 2015
Slide31• • • 0+
0
+ decays
: limits
on exotic
currents
32
Ar:
Adelberger
et
al
., PRL 83 (1999) 1299
B. R. Holstein, J.
Phys
.
G 41
(
2014) 114001
Hardy &
Towner,
Phys. Rev. C 91 (2015) 025501
38m
K: Gorelov, Behr et al
., PRL
94 (2005) 142501
with:
Slide32Super-allowed Fermi transitions for
T
z
= -1
Slide33•
•
•
10C
measurement at ISOLDE
catcher
profiler
Proton beam at 1.4 GeV
and 2mA
Target: CaOSource: VADIS
Slide34• • • 10C/
19
Ne decay
scheme
to
determine the BR
10Cto evaluate pile-up
19
Ne
Slide35• • •
10C experimental
set-up
and analysis
procedure
19
Ne: similar T1/2 similar QECno 1022 keV
peak, only 511-511
pile-up
10
C
:
1022
keV
line + 511+511 pile-up
p
ile-up
shape
and
intensity
adjusted
with
511keV
peak
, 19Ne +
sim.
Slide36• • • 10C and
19
Ne release
Release time
much longer for 10C160Contaminants: 13N2, 14O12C
use 19Ne to study pile-up conditionsuse MC simulations for 19Ne and
10C to
determine pile-up contribution
Run
= 94
Run
= 118
10
C
19
Ne
Slide37• • • 19Ne simulation
results
+ time
d
istribution
sim
.
spectrum
Slide38• • • 10C
: very preliminary result
…to
be
fully
analysedglobal correction, not yet run by run
Slide390+ - 0+ b
decay
: 10C at ALTO/Orsay
Slide40• • • 10C
measurement at ALTO/
Orsay
Scientific Manager:
M.
Lebois
Technical Manager: B. Genolini
100 Ge
crystals
: 5.5% @ 1 MeV
18 LaBr
3
: 1.5% @ 1 MeV
Slide41• • • 10C
measurement at ALTO/
Orsay
Multi-detector
array
Ge detectors versus
scintilators
Basically no pile-up with plastics…. lets see once the analysis
is done
Slide42• • • 10C
decay
scheme
Decay of interest Calibration reaction
…
additional
measurement of 19Ne decay
Slide43• • • 10C
decay
data
Measurements
:10
C (11B [300-400 mg/cm2] on 4 mg Au backing
): 511 keV: 1.4 e9 718 keV: 1.2 e81022 keV: 1.6 e610B (11B [300-400 mg/cm2] on 4 mg Au backing):
414 keV: 8.5 e7 718 keV: 4.5 e61022 keV: 3.5 e619Ne (CaF
[400-500 mg/cm2] &
PbF on 4 mg Au backing)
):
511
keV
: 4.6 e8
expected
overall
statistical
precision
:
< 0.1 %
Slide44Future measurements at GANIL
Slide45• • • Heavy T
z
= 0 nuclei
test CVC on a
much
larger basis
Slide46• • • Heavy T
z
= 0 nuclei: production at S3-LEB
T
z
= 0
isotopehalf-life (ms)production rate (
pps)66As95.77(23)5000070
Br79 .1(8)
35000
74
Rb
64.776(30)
30000
78
Y
54(5)
1500
82
Nb
50(5)
300
86
Tc
55(6)
250
90
Rh
15(7)
200
94
Ag
37(18)40098In37(5)0.3 test CVC over a larger range of Z
Slide47• •
•
S3-LEB + DESIR
S3
beams
into DESIRneed of fast gas cellpurification with HRS + MR-TOF-MS or PIPERADEbest place world-wide
to do this
Slide48Mirror b decays
Slide49Experimental ft measurements•
• •
Nuclear
mirror beta decay
in general:
for
mirror transitions: vector and axial-vector currents experimental quantities: precise measurements of masses of parent and daughter, half-life, branching ratio, mixing ratio correct for other interactions:
many transitions: validate corrections, test
CVC
, determine
V
ud
matrix
element, test
CKM
matrix unitarity…
T
1/2
Q
EC
BR
1/2
+
1/2
+
Slide50Mirror b decays: 23Mg,
27
Si, 37
K
Slide5151 / 25
•
•
•
Experiment JYFL2013: 23Mg & 27Si
Slide52temps (s)coups
•
•
• Results of 23
Mg and 27Si
C. Magron et al., EPJA 53 (2017) 55T1/2 = 11.303(3) s
coups
440 keV
511 keV
40
K
1461 keV
canaux
23
Mg:
T
1/2
= 11.303(3)
s Lit. = 11.330(8)
s
BR = 7.81(8) % Lit. = 8.13(12) %
BR
sa
= 92.07(14) %
27
Si:T1/2 =
4.112(2) s Lit. = 4.135(15)
s
BR = 0.164(28) % Lit. = 0.151(9) %
BRsa
=
99.74(2) %BR = 7.81(8) %
23
Mg23
Mg
23Mg
Slide53• • • 37
K decay
at ISOLDE
Proton
beam
at 1.4
GeV
and 2mATarget: CaOSource: VADIS
Slide54• • • Nuclear mirror beta decay:
37
K at ISOLDE
T
1/2
= 1.23635(88) s
BR = 97.96(14) %…to be published
T. Kurtukian Nieto et al.
37
K
37
K
Slide55• • • Nuclear mirror beta decay: improvements
Recent
measurements
at GANIL:
T
1/2: 17F, 19Ne, 21Na, 33Clr: 19Ne, 35Ar
Slide56High-precision Germanium detector is availableTz = -1 nuclei have be addressed:
10
C,
22Mg,
30
S Multi-detector array: 140 Ge and LaBr3 detector
Branching ratio measurement of 10C Potential for nuclear mirror decays:
23Mg, 27Si, 37K
need for high-precision GT-F mixing ratio measurements
SPIRAL2/S3-LEB/DESIR
: heaviest N=Z odd-odd nuclei
CVC tests over much broader
range
Theoretical
corrections
…. work on-going at CENBG
(N.
Smirnova
et al.)
•
•
•
Conclusions
Slide57N. Smirnova, Y. Lam, L. Xayavong et al.
•
•
•
Theoretical corrections (sd shell)
Slide58High-precision Germanium detector is availableTz = -1 nuclei have be addressed:
10
C,
22Mg,
30
S Multi-detector array: 140 Ge and LaBr3 detector
Branching ratio measurement of 10C Potential for nuclear mirror decays:
23Mg, 27Si, 37K
need for high-precision GT-F mixing ratio measurements
SPIRAL2/S3-LEB/DESIR
: heaviest N=Z odd-odd nuclei
CVC tests over much broader
range
Theoretical
corrections
…. work on-going at CENBG
(N.
Smirnova
et al.)
•
•
•
Conclusions
Slide59Thanks for your attention
Collaborations: CENBG, GANIL, IPNO, LPC Caen,
TRIUMF, Univ. of Guelph, JYFL
Slide60Slide61• • • 42Ti
heaviest
T
z
= -1 nucleus accessible
with high statisticsup to factor of 3 difference in dC
only feasible at GANIL
Slide62• • • 18Ne
Light nucleus important for
physics
beyond
the standard model
up to factor of 3 difference in dC
easily feasible at SPIRAL1
Slide63Calibration
Procedure
X-ray
radiography
g
-ray detector scans source measurements MC simulations (GEANT4 or CYLTRAN) develop a model of the detector to calculate efficiencies
at any energy at a fixed
distance of 15 cm
Slide64X-ray
photography
of detector
rough size of
crystal
tilt of
crystal with respect to detector housing of 1° according
to GEANT4 simulations no influence on results
Slide65AGATA scan table at CSNSM: strongly collaminated 137
Cs source
HPGe
X-Y table
137
Cs (477MBq)
A.
Korichi
et al.
Gamma-ray scan of detector
Slide66Longitudinal scan: 662
keV
excellent full-
energy
peak spectrum
good total-energy spectrum
Slide67Front
scan: 662
keV
effect
of detector tilt
clearly visible reasonable overall agreementtotalfull energy
Slide68Perpendicular
scan: 662
keV
effect
of detector tilt clearly visible reasonable overall agreementfull energytotal
Slide69Calibration sources
peak
-to-total sources:
close to « one single g ray with
100% branching ratio » standard sources: 22Na, 51Cr, 54Mn, 57Co, 60Co, 65Zn, 85Sr, 137Cs short-lived online sources
at ISOLDE: 38K, 41Ar, 58Co relative efficiency sources: a few well-known branches (BR error <1%)
at largely different
energies standard sources
:
60
Co,
88
Y
, (
109
Cd),
133
Ba,
134
Cs,
137
Cs,
152
Eu, 207Bi short-lived online sources at
ISOLDE and IPN Orsay: 24
Na, 27Mg, 48Cr, 56Co,
66Ga, 75Se, 169
Yb, 180mHf
absolute efficiency:
60
Co with activity precision of 0.7‰ g-g coincidences
Slide70• • •
Calibration of germanium detector: peak-to-total
T/P (
exp
)
sim
: no backscatter materialsim: with backscatter material
Slide71•
•
•
Calibration of germanium detector: absolute efficiency
relative measurement: all sourcesabsolute measurement:
60Co
Slide72Fit 1: P
0 =
-0.016 ± 0.061;
2 = 0.85
<
0.6 ‰
precisionFit 2: P0 = -0.09 ± 0.48 P1 = 0.02 ± 0.16; 2 = 0.86
• • • Calibration of germanium detector: absolute efficiency
60
Co
De
< 5
‰
De
< 1.5
‰
B.
Blank
et al., NIMA 776 (2015) 34
Slide73sourceXGe
E
g
1
, Br1 = 99.85 %
I1
Eg2, BR2 = 99.99826 % I2 three unknowns: A0, e1, e
2 three equations e1, e
2
Condition:
g-g
cascade with large BR
no « cross-over » transition
60
Co (et
24
Na)
standard pile-up is same for all peaks
but: necessity to correct pile-up between
two events (1173
1
+ 1332
2
et vice-versa)
I1 = A0 *
e
1
* BR1 * (1.-
e
t2
* w12()) I2 = A0 * e2 * BR2 * (1.-et1 * w12()) I12 = A0 * e1 * e2 * BR12 * w12() I12 = I12’ – I12_11 – I12_22 I12_11 = I11 * e
2 / e
1 * BR2 / BR1
I12_22 = I22 * e1
/ e
2 * BR1 / BR2
e
t2 : from other measurements
w12(): from calculations
E
g1 + Eg2 , BR12
I12
•
•
•
Absolute efficiency calibration with
g-g
coincidences
X
4+
2+
0+
Slide74e1 (g-g) = (
0.
2186 ±
0.0007) %
e1
(source act.) = (
0.2175 ± 0.0003) % e2 (g-g) = (0.1996
± 0.0007) % e2 (source act.) =
(0.1996 ± 0.0003) %
•
•
•
Absolute efficiency with
g-g
coincidences:
60
Co
1173 + 1173
1332 + 1332
1173 1332
1173+1332
1173+1332
… do
24
Na at
ISOLDE?
Slide75Primary Beam:28Si,
32S,
46Ti @ 50
MeV/A
Production Target :
natNi
90 mmLISE3 SpectrometerGANIL / LISE3 experiments
DetectionSet-up
•
•
•
Super-allowed emitter production at GANIL/LISE3
26
Si
30
S
42
Ti
…
30
S
Slide76Phase 1
Phase 2
NFS and S3 experiments
for DESIR:
SPIRAL1
(light nuclei from beam/target fragmentation)
SPIRAL2 (n-rich fission fragments, transfer and fusion-evaporation products) at earliest 2020
S3 (fusion-evaporation, refractory elements) SPIRAL2 beam accelerated by CIME
•
•
•
SPIRAL2 facility
Phase 1+
Slide77T
1/2
Q
EC
BR
0
+
0+
•
•
•
Nuclear beta decay
0
+
→
0
+
:
Ft = ft (1 +
d
R
’
) (1 –
d
c
+
dNS ) = = cnstK2
F
2
V
M
g
(1 +
D
R)
T
1/2
Q
EC
BR
1/2
+
1/2
+
Ft = ft (1 +
d
R
’
) (1 –
d
c
+
d
NS
) =
K
2
F
2
V
M
g
(1 +
D
R
)
x
1
(1 + f
a
/f
v
)
r
2
Precision measurements required: 10
-3
Q
EC
→
mass measurements:
f ~ Q
EC
5
T
1/2
, BR
→
b
-decay studies:
t = T
1/2
/ BR
r
2
→
b
-decay angular correlation studies
f(weak interaction) ~ 2.4%
f(nucl. structure)
~ 0.3-1.5%
f(Z, Q
EC
)
~ 1.5%
additional measurement
needed
mirror decays:
= cnst
Slide78Double Penning trap for high-resolution separation
at
DESIR facility of SPIRAL2
Requirements
Purify large samples (>104
ions) Mass resolution > 105 Fast separation methods•
• • PIPERADE at DESIR
Test
set-up
at
CENBG
Bordeaux
P.
Ascher
et al., EPJ Web of
Conf
. 66, 11002 (2014)
Collaboration:
CEN Bordeaux-Gradignan
MPIK Heidelberg
CSNSM Orsay
GANIL Caen
LPC Caen
Slide79• • • 0+
0
+ decays
: d
c corrections
large discrepancy between different models
particular effects around shell closure: 18Ne, 30S, 42Ti
Courtesy G.F.
Grinyer
for
18
Ne (N=8), for
30
S (N=14), and for
42
Ti (N=20): closed neutron shell
daughters
18
F (
17
F+n),
30
P (
29
P+n) , and
42
Sc (41Sc+n):
neutron added by the decay populates a neutron orbital that was empty at the N=8 and N=20 "magic numbers" maybe not too surprising
but even stronger effect at the sub-shell closure N=14
needs experimental confirmation
Slide80
V
ud
= 0.9717(17
)
(10 times
less
precise
than
0
+
-0
+
)
•
•
•
Results: mirror beta decay world data
N. Sewerjins, O. Naviliat Cuncic
Slide81Super-allowed Fermi transitions for
T
z
=
0
close to 100% g.s. to g.s. transition low precision needed for non-analog transitions
Slide82• • • 19Ne simulation
results
Slide83• • • 19Ne simulation
results
Slide84• • • 19Ne simulation
results
Slide85• • • 10C and
19
Ne release
Release time
much longer for 10C160Contaminants: 13N2, 14O12C
use 19Ne to study pile-up conditionsuse MC simulations for 19Ne and
10C to
determine pile-up contribution
Slide86• • • 19Ne simulation
results
+ time
d
istribution
sim
. spectrum
Slide87• • • 19Ne simulation
results
Slide88• • • 19Ne simulation
results
Slide89• • • 19Ne simulation
results
Slide902p
known cases
BigRIPS (+ZDS)
78
Kr at 345 MeV/
u
– 250 pnA
setting on
51
Ni (10.5 h)
setting on
65
Br (115 h)
setting on
64
Se (50 h)
setting on
62
Se (48 h)
BigRIPS
ZDS
WAS3AB
i
3 DSSSD
β
veto
+ EURICA (Ge array)
BigRIPS experiment May-June 2015
Slide91Particle Identificationregion of2p and new
isotopes
Z
A/Q
Ni
Zn
GeSe
Tz = -5/2 -2 -3/2 -1 -1/2 063Se
59Ge
58Zn
60Ge
64Se
Kr
Br
As
Ga
Cu
67Kr
78Kr