
The Role of Senior Nutrition Programs Going Forward Linda Netterville RDN LD Dietitian Consultant AAA Section HHSC OAA Title III Part C Nutrition Services Section 330 Reauthorized 3252020 ID: 933233
Download Presentation The PPT/PDF document "Hunger and Malnutrition:" is the property of its rightful owner. Permission is granted to download and print the materials on this web site for personal, non-commercial use only, and to display it on your personal computer provided you do not modify the materials and that you retain all copyright notices contained in the materials. By downloading content from our website, you accept the terms of this agreement.


Slide1
Hunger and Malnutrition: The Role of Senior Nutrition Programs Going Forward
Linda Netterville, RDN, LD
Dietitian Consultant
AAA Section, HHSC
Slide2OAA Title III Part C Nutrition Services (Section. 330)Reauthorized 3/25/2020The goal of the OAA program is included in the federal law
R
educe hunger, food insecurity, and
malnutrition
P
romote socialization of older individuals
P
romote the health and well-being
Slide3COVID-19 Changed Business as Usual
Increased need for community-based nutrition resources
Reached a population who had not been served (service increases)
Creative solutions to address food access
Health and safety awareness
Use of technology
Learned to change rapidly and adapt
Slide4Consequences of Poor Diet on Health
Slide5Consequences of Poor Diet on Functionality
Slide6Hunger and Food Insecurity
Hunger
is an
individual-level physiological condition
that may result from food insecurity.
Food insecurity
is a
household-level economic and social condition
of limited and uncertain access to adequate food
Slide7USDARanges of Food Security and Food InsecurityMarginal food security -Households had problems at times, or anxiety about, accessing adequate food, but the quality, variety, and quantity of their food intake were not substantially reduced.
Low food security
-Households reduced the quality, variety, and desirability of their diets, but the quantity of food intake and normal eating patterns were not substantially disrupted.
Very low food security
-Eating patterns of one or more household members were disrupted and food intake reduced because the household lacked money and other resources for food.
Slide8Texas Older Adults(2020)
Senior population (60+)
5,123,709 Million (18%)
Rank: 49
th
in US
Seniors threatened by hunger (Marginally food insecure)
1,019,618 Million (20%)Rank: 12th in USSeniors at risk of hunger(Food insecure)
548,237 (11%)Rank: 6th in USSeniors facing hunger (Very low food secure)
189,577 (4%)Rank: 13th in US
www.mealonwheelsamerica.org/facts
Slide9Texas Risk Factors for Food Insecurity
Slide10Texas Risk Factors for Food Insecurity
Risk Factor
% of Senior Pop.
Black or African American
10%
Hispanic or Latino
24%Living alone21%
Disability31%Self-reporting “fair to poor health”30%
Risk Factor
% of Senior Pop.Living below poverty line11%Lack income to pay for basic living needs-Singles
50%Lack income to pay for basic living needs-Couples24%
Slide11Malnutrition
Malnutrition
is a
clinical state
where the body does not get the
right balance of nutrients
to support optimal functioning.
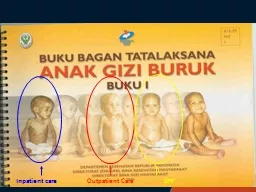
Slide12What is Malnutrition?
Slide13Malnutrition: A National Perspective
Slide14Malnutrition: A Texas Perspective
Cost of 1 HDM/Congregate Meal
Cost of 1 day in a hospital
Cost of 1 day in a nursing home
$9.84/8.85
$2,604
$160
www.mealonwheelsamerica.org/facts
Slide15Hunger, Food Insecurity, and Malnutrition Putting it into Practice
Slide16Determine Your Nutritional Health
This screening tool measures nutrition risk not malnutrition
Slide17Identifying Food InsecurityUSDA-ERS Screening ToolsU.S. Household Food Security Survey Module (18 questions)U.S. Adult Food Security Survey Module (10 Questions)
Short Form of the Food Security Survey Module (6 questions)
Slide18Malnutrition Risk AssessmentLonger version available Questions A-RMalnutrition Indicator
24-30 points Normal nutritional status
17-23.5 points At risk of malnutrition
< 17 points Malnourished
Slide19Profile of Seniors Receiving OAA Meals-Texas
Demographic
% of OAA Served-Texas
% of TX Senior Population
Rural
34%
21%Below poverty line44%
11%Live alone44%21%Black or African American18%
10%Hispanic or Latino32%24%
www.mealonwheelsamerica.org/facts
Slide20OAA Congregate Nutrition Programs are Effective
Normal age-related changes such as taste, smell, and appetite
53 percent of participants are aged 75 and older, compared to 30 percent of the U.S. population over 60 years old.
Reduced social contact
59 percent of participants are living alone, compared to 25 percent of the U.S. population over 60 years old.
81 percent say they saw friends more often due to the program.
Increased access to food or healthy foods
54 percent of participants indicated the one congregate meal provides one-half or more of their total food for the day.
80 percent said they eat healthier because of the meal program.
76 percent of participants believe their health has improved as a result of the Congregate Program.
71 percent of participants report the program helped them live independently and remain in their home.
Slide21OAA Home-delivered Nutrition Programs are Effective
Normal age-related changes such as taste, smell, and appetite
62 percent of participants are 75 years or older, compared to 30 percent of the U.S. population over 60 years old.
Reduced social contact.
60 percent of participants live alone, compared to 25 percent of the U.S. population over 60 years old.
Limited access to food or healthy foods
66 percent of participants indicate that a home-delivered meal provides one-half or more of their total food for the day.
90 percent of participants say they eat healthier because of a meal program.
76 percent of participants have difficulty getting outside the house, limiting their ability to shop for food.
90 percent of participants report the program helped them live independently and remain in their home.
Limited or impaired mobility.
36 percent reported needing assistance with one or more activities of daily living (ADLs).
78 percent needed assistance with one or more instrumental activities of daily living, such as shopping, housework and food preparation (IADL).
Slide22Malnutrition Intervention in Older Adults
Slide23Beyond the Meal-
Nutrition Support Services
Educate individuals, families, and caregivers
Individualized nutrition counseling
Medical nutrition therapy
Nutrition support groups, diabetes, heart disease
Menu planning and shopping assistance
Grocery delivery
Referral services
Transportation support
Slide24Community Support Services
Slide25Federal Nutrition Assistance ProgramsUSDA
Program
Entitlement
Discretionary
Low-Income or Means Test Eligibility
Other Eligibility
SNAP
X
X
SNAP-ED
X
X
FDPIR (Food Distribution Program on Indian Reservations)
X
X
X
CSFP (Commodity Supplemental Food Program) X
XXCACP (Child and Adult Care Food Program) X XXTEFAP (Temporary Emergency Food Program) XX SFNMP (Senior Farmers Nutrition Market) XXX
Slide26Federal Nutrition Assistance ProgramsHealth and Human Services
Program
Entitlement
Discretionary
Low-Income or Means Test Eligibility
Other Eligibility
OAA Title III C Nutrition Program
X
X
Medicare (Part C-Medicare Advantage)
X
X
Medicaid Waiver
X
X
X
Slide27Know your community partners
Food assistance programs
Feeding Texas
Local Food Banks
Community and Faith-based services
Hospital/Healthcare
Civic Organizations
Slide28Lessons from COVID-19Be Nimble
Be Quick
Slide29Lessons from COVID-19
Sometimes it worked!
Sometimes it didn’t!
Slide30Thank You!Linda Netterville, RDN, LDDietitian ConsultantAAA Section, HHSC
Email:
Linda.Netterville@comcast.net