

Return amp Their Regulation 2 Heart Cardiac Cycle The repetitive pumping action that produces pressure changes that circulate blood throughout the body Cardiac Output The total amount of blood separately pumped by each ventricle per minute usually expressed in liters per minute ID: 913520
Download Presentation The PPT/PDF document "1 Cardiac Output , Venous" is the property of its rightful owner. Permission is granted to download and print the materials on this web site for personal, non-commercial use only, and to display it on your personal computer provided you do not modify the materials and that you retain all copyright notices contained in the materials. By downloading content from our website, you accept the terms of this agreement.


Slide1
1
Slide2Cardiac Output
, Venous
Return,& Their Regulation
2
Slide3Heart
Cardiac Cycle
The repetitive pumping action that produces pressure changes that circulate blood throughout the body
Cardiac Output
The total amount of blood separately pumped by each ventricle per minute, usually expressed in liters per minute
3
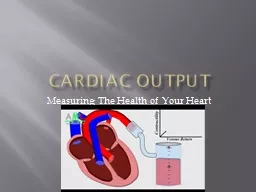
Slide4Cardiac Output
Normal cardiac output = 5 to 6 liters per minute (LPM)
Can increase up to 30 LPM in times of stress or exercise
Determined by multiplying the heart rate by the volume of blood ejected by each ventricle during each beat (stroke volume)
CO = HR x SV
CO is influenced by:
Strength of contraction
Rate of contraction
Amount of venous return available to the ventricle (preload)
4
Slide5Cardiac output & Venous return
Cardiac output
is the quantity of blood pumped
into the
aorta each minute by the heart.
Venous return
is the quantity of blood
flowing from
the veins into the right atrium each minute.The venous return and the cardiac output must equal each other except for a few heartbeats at a time when blood is temporarily stored in or removed from the heart and lungs.5
Slide6Normal Values for CO at
Rest
& During Activity
Cardiac output varies widely with the level of activity of the body.
Factors which directly
affect cardiac output:
(
1) Level of body metabolism (2) Exercise (3) Age (4) Size of the body.For young
,
healthy men
, resting cardiac output averages about
5.6 L/min.
For
women, this value is about 4.9 L/min.
6
Slide7Cardiac Index
Experiments
have shown that the cardiac output increases approximately in
proportion to
the surface area of the body
.
Cardiac output
is frequently
stated in terms of the cardiac index, which is the cardiac output per square meter of body surface area. The normal person weight = 70 KgBody surface area = 1.7 sq mwhich means that the normal average cardiac
index for
adults is about 3 L/min/m2 of body surface area
.
7
Slide8Effect of Age on Cardiac Output
Cardiac Index Rises
rapidly to a level greater
than 4
L/min/m2 at age 10 years, the cardiac index declines to about 2.4 L/min/m2
at age 80 years.
The cardiac
output is
regulated throughout life almost directly in proportion to the overall bodily metabolic activity. Therefore, the declining cardiac index is indicative of declining activity with age.8
Slide9Arteries
Tunica Adventitia
Tunica Media
Tunica Intima
Arteriole
Capillary: 7% of total blood volume
Venule
Vein
Constriction returns 20% (1 liter) of blood to active circulation
}
64% of blood volume
}
13% of blood volume
Circulatory System
9
Slide10Circulatory System
10
Slide11Circulatory System
Key Terms
Stroke Volume
Preload
Ventricular Filling
Starling’s Law of the Heart
Afterload (End Diastolic Pressure or EDP)
Cardiac Output
SV x HR 5 liters/minuteFick Principle
11
Slide12Fick Principle
A method for measuring cardiac output.
The Fick principle assumes that the quantity of oxygen delivered to an organ is equal to the amount of oxygen consumed by that organ plus the amount of oxygen carried away from that organ.
Used to estimate perfusion either to an organ or to the whole body when oxygen content of both the arterial and venous blood is known and oxygen consumption is assumed to remain fixed.
12
Slide13The Fick Principle
" The total
uptake of (or release of) a substance by the peripheral tissues is equal to the product of the blood flow to the peripheral tissues and the arterial-venous concentration difference (gradient) of the substance
.“
It is the blood flow we are interested in:
this is cardiac output
. This method is the purest and most accurate means of estimating the cardiac output
.
It is not confused by low output states,
valvular
regurgitation, shunts or arrhythmias. The major source of error is the act of measuring the amount of exhaled oxygen, and the change in cardiac output over the period of measurement
.
13
Slide14The principle in detail
VO2
, the oxygen consumption, is simply the difference between the inspired and expired O2. You can measure it with an exhaled gas collection bag
. You
can also estimate it. Conventionally, resting metabolic consumption of oxygen
is 3.5
ml of O2 per kg per minute,
or 125ml
O2 per square meter of body surface area per minute.
Lets say the meaty pinkish lump below is the patient.
14
Slide15We can rearrange that to form an equation which calculates cardiac output on the basis of oxygen extraction
:
So, in a normal person, with a body surface area of 2m2 and thus with a VO2 of 250ml per minute,
CO = 250ml / (200ml – 150ml
)
= 250 / 50
= 5
L/min
And there you have it. That is the "direct" Ficks method for measuring cardiac output.15
Slide16Control of Cardiac Output by Venous
Return—Role of the Frank-Starling
Mechanism of the Heart
When one states that cardiac output is controlled by venous return, this
means that
it is not the heart itself that is the primary controller of cardiac output
.
Instead, it is the various factors of the peripheral
circulation that affect flow of blood into the heart from the veins, called venous return, that are the primary controllers.The main reason peripheral factors are usually more important than the heart itself in controlling
cardiac output
is that the heart has a built-in mechanism
that normally
allows it to pump automatically
whatever amount
of blood that flows into the right atrium from the veins. This mechanism, called the Frank-Starling law of the
heart
.
16
Slide17The total resistance against which blood must be pumped.
It is essentially a measure of friction between the vessel walls and fluid, and between the molecules within the fluid itself (viscosity).
Both oppose flow.
When resistance to flow increases, blood pressure must increase for the flow to remain constant.
17
Peripheral Vascular Resistance (Afterload)
Slide18Frank-Starling law of the heart,
This law states:
“ When increased
quantities of
blood flow
into the heart, the increased blood stretches
the walls
of the heart chambers. As a result of the stretch
, the cardiac muscle contracts with increased force, and this empties the extra blood that has entered from the systemic circulation”. Therefore, the blood that flows into the heart is automatically pumped without
delay into
the aorta and flows again through the circulation.
18
Slide19When the rate at which blood flows into the heart from the veins (venous return) changes, the heart automatically adjusts its output to match inflow.
The more blood the heart receives the more it pumps…
Increased end diastolic volume
increases contractility
.
Increases stroke volume.
Increases cardiac output.
Starling curves at any end-diastolic volume.
Increased sympathetic input increases stroke volume. Decreased sympathetic input decreases stroke volume.19Starling’s Law of the Heart
Slide20STRETCHING THE HEART CAUSES THE HEART TO PUMP FASTER
Another important
factor is
that stretching the heart causes the heart to
pump faster—at
an increased heart rate
.
That
is, stretch of the sinus node in the wall of the right atrium has a direct effect on the rhythmicity of the node itself to increase heart rate as much as 10 to 15 %The stretched right atrium initiates a nervous reflex called the BAINBRIDGE REFLEX, passing first to the
vasomotor center
of the brain and then back to the
heart by
way of the sympathetic nerves and
vagi
, also to increase the heart rate.
20
Slide21Cardiac Output Regulation Is the
Sum of
Blood Flow Regulation in All the Local Tissues of the Body Tissue Metabolism
Regulates Most
Local Blood
Flow
The venous return to the heart is the sum of all the local blood flows through all the individual tissue segments of the peripheral circulation. Blood flow increases
in proportion to each tissue’s metabolism.
Local blood flow always increases when tissue oxygen consumption increasesAt each increasing level of work output during exercise, the oxygen consumption & the CO increase in parallel to each other.
21
Slide22Effect of Total Peripheral Resistance on the Cardiac Output
Level.
The long-term CO level varies
reciprocally with changes in total
peripheral resistance
.
CO= 1/PR
When the total peripheral
resistance is exactly normal the cardiac output is also normal. When the total peripheral resistance increases above normal, the cardiac output falls; conversely, when the total peripheral resistance decreases, the cardiac output increases. 22
Slide23Ohm’s
law,
One can easily
understand this
by reconsidering one of the forms of
Ohm’s law
Cardiac Output = Arterial Pressure
Total
Peripheral ResistanceThe meaning of this formula:Any time the long-term level of total peripheral resistance changes (but no other functions of the circulation change), the cardiac output changes quantitatively in exactly the opposite direction.23
Slide24Cardiovascular System Regulation
PNS and SNS always act in balance
Baroreceptors: monitor BP
Chemoreceptors
Hormone regulation
Reabsorption of tissue fluids
24
Slide25Cardiovascular System Regulation
Parasympathetic Nervous System
Decrease
Heart rate
Strength of contractions
Blood pressure
Increase
Digestive system
Kidneys25
Slide26Cardiovascular System Regulation
Sympathetic Nervous System
Increase
Body activity
Heart rate
Strength of contractions
Vascular constriction
Bowel and digestive viscera
Decreased urine productionRespirationsBronchodilationIncreases skeletal muscle perfusion
26
Slide27Factors That Can Cause Hyper effective
Heart
Only two types of factors usually can make the
heart a
better pump than normal
.They are
(
1) nervous
stimulation (2) hypertrophy of the heart muscle.27
Slide28A. Effect of Nervous Excitation to Increase Heart Pumping.
Combination of (
1)
sympathetic
stimulation
(
2)
parasympathetic
inhibition does two things to increase the pumping effectiveness of the heart: (1) It greatly increases the heart rate— sometimes, in young people, from the normal level of 72 beats/min up to 180 to 200 beats/min—(2)
It increases
the strength of heart contraction (which
is called
increased “contractility”) to twice its
normal strength
. Combining these two effects, maximal nervous excitation of the heart can raise the
plateau level
of the cardiac output curve to almost twice
the plateau
of the normal
curve.
28
Slide29B. Increased
Pumping
effectiveness Caused by Heart Hypertrophy.
A long-term increased workload, but not so
much excess
load that it damages the heart, causes the
heart muscle
to increase in mass and contractile strength
in the same way that heavy exercise causes skeletal muscles to hypertrophy. e.g. it is common for the hearts of marathon runners to be increased in mass by 50 to 75 %. This increases the plateau level of the cardiac output curve, sometimes 60 to 100
%, and
therefore allows the heart to pump much
greater than
usual amounts of cardiac output
.
When one combines nervous excitation of the heart and hypertrophy, as occurs in marathon runners,
the total
effect can allow the heart to pump as much 30
to 40
L/min, about
2 1/2
times normal; this increased
level of
pumping is one of the most important factors
in determining the runner’s running time.29
Slide30Factors That Cause a Hypo effective
Heart
Any factor that decreases the heart’s ability to
pump blood
causes
hypo affectivity. Some
of the factors
that can
do this are the following:Coronary artery blockage, causing a “heart attack”Inhibition of nervous excitation of the heartPathological factors that cause abnormal heart rhythm or rate of heartbeat Valvular heart disease Increased arterial pressure against which the heart must pump, such
as in
hypertension
Congenital
heart
disease
Myocarditis Cardiac hypoxia
30
Slide31What Is the Role of the Nervous
System in
Controlling Cardiac Output?
IMPORTANCE OF THE NERVOUS SYSTEM IN MAINTAINING THE ARTERIAL PRESSURE WHEN THE VENOUS RETURN AND CARDIAC OUTPUT INCREASE
Under normal
conditions, the vasoconstrictor area of
the vasomotor
center transmits signals continuously
to the sympathetic vasoconstrictor nerve fibers over the entire body, causing continuous slow firing of these fibers at a rate of about one half to two impulses per second.This continual firing is called sympathetic vasoconstrictor tone. These impulses normally maintain a partial state of contraction in the blood vessels,
called
vasomotor
tone
.
31
Slide32Vasomotion
Regulated primarily by the concentration of oxygen in the tissues.
When oxygen concentration is low, the cells lining and adjacent to the closed capillaries secrete histamine, which is thought to be responsible for arteriolar smooth muscle vasodilation, causing the capillary to open.
32
Slide33Vasomotion
Histamine is quickly destroyed in the blood and does not enter the general circulation.
As cells become re oxygenated
they stop the histamine secretion, and the capillary closes.
33
Slide34Vasomotion
A decrease in oxygen concentration leads to a local release of vasodilating substances, which allows blood flow to increase.
This in turn increases the delivery of oxygen and restores aerobic metabolism.
34
Slide35vasomotor center
At the same time that the vasomotor center is controlling the amount of vascular constriction, it also controls heart activity
.
The
lateral
portions of the vasomotor center transmit excitatory impulses through the sympathetic nerve fibers to the heart when there is need to increase heart rate and contractility.
Conversely
, when there is need to decrease heart pumping, the medial portion of the vasomotor center sends signals to the adjacent dorsal motor nuclei of the vagus nerves, which then transmit parasympathetic impulses through the vagus nerves to the heart to decrease heart rate and heart contractility. Therefore, the vasomotor center can either increase or decrease heart activity. Heart rate and strength of heart contraction ordinarily increase when vasoconstriction occurs and ordinarily decrease when vasoconstriction is inhibited.
35
Slide36Effect of the Nervous System to Increase the Arterial Pressure During Exercise
During exercise, intense increase in metabolism in active skeletal muscles acts directly on the muscle arterioles to relax them and to allow adequate oxygen and other nutrients needed to sustain muscle contraction. Obviously, this greatly decreases the total peripheral resistance, which normally would decrease the arterial pressure also.
The nervous system immediately compensates. The same brain activity that sends motor signals to the muscles sends simultaneous signals into the autonomic nervous centers of the brain to excite circulatory activity, causing large vein constriction, increased heart rate, and increased contractility of the heart.
All these changes acting together increase the arterial pressure above normal, which in turn forces still more blood flow through the active muscles
.
36
Slide37Pathologically High
and Pathologically
LowCardiac Outputs
In healthy human beings, the cardiac outputs
are surprisingly
constant from one person to another
. However
, multiple clinical abnormalities can
cause either high or low cardiac outputs.High Cardiac Output Caused by Reduced Total Peripheral Resistance One of the distinguishing features of these conditions is that they all result from chronically reduced total peripheral resistance. None of them result from excessive excitation of the heart
itself.
37
Slide38Conditions that
can decrease the peripheral resistance
& increase the cardiac output to above normal.
1
.
Beriberi.
This
disease is caused by
insufficient quantity of the vitamin thiamine (vitamin B1) in the diet. Lack of this vitamin causes diminished ability of the tissues to use some cellular nutrients, and
the local
tissue blood flow mechanisms in turn
cause marked
compensatory peripheral vasodilation
. Sometimes
the total peripheral resistance decreases to as little as one-half normal. Consequently, the long-term
levels of venous return and
cardiac output
also often increase to twice normal.
2.
Arteriovenous
fistula (shunt).
Whenever a
fistula (also called an
AV shunt) occurs between a major artery and a major vein, tremendous amounts of blood flow directly from the artery into the vein. This, too, greatly decreases the total peripheral resistance and, likewise, increases the venous return and
cardiac output.38
Slide393.
Hyperthyroidism
. In
hyperthyroidism, the metabolism of most tissues of the body becomes greatly increased. Oxygen usage increases, and vasodilator products are released from the tissues. Therefore, the total peripheral resistance decreases markedly because of the local tissue blood flow control reactions throughout the body; consequently, the venous return and cardiac output often increase to 40 to 80
%
above normal.
4.
Anemia
. In anemia, two peripheral effects greatly decrease the total peripheral resistance. One of these is reduced viscosity of the blood, resulting from the decreased concentration of red blood cells. The other is diminished delivery of oxygen to the tissues, which causes local vasodilation.
As a consequence
, the cardiac output increases greatly
. Any
other factor that decreases the total
peripheral resistance
chronically also increases the cardiac output.
39
Slide40Low Cardiac Output
THESE CONDITIONS FALL INTO TWO CATEGORIES:
(
1)
Those abnormalities that cause
the pumping effectiveness of the heart to fall too low and
(
2)
Those that cause venous return to fall too low.40
Slide41Decreased Cardiac Output Caused by Cardiac Factors.
Whenever the
heart becomes severely damaged,
regardless of
the cause, its limited level of pumping may fall
below that
needed for adequate blood flow to the
tissues
. examples (1) severe coronary blood vessel blockage and consequent myocardial infarction, (2) severe valvular heart disease,
(
3)
myocarditis
,
(
4) cardiac tamponade, (5)
cardiac metabolic derangements.
When
the cardiac output falls so low that the
tissues throughout
the body begin to suffer nutritional deficiency
, the
condition is called
cardiac shock.
41
Slide42Decrease in Cardiac Output Caused by Non-cardiac
Peripheral Factors—Decreased
Venous Return.
ANYTHING THAT INTERFERES WITH VENOUS RETURN ALSO CAN LEAD TO DECREASED CARDIAC OUTPUT. SOME OF THESE FACTORS ARE THE FOLLOWING
:
1.
DECREASED BLOOD VOLUME
.
By far, the most common non-cardiac peripheral factor that leads to decreased cardiac output is decreased blood volume, resulting most often from hemorrhage. It is clear why this condition decreases the cardiac output: Loss of blood decreases the filling of the vascular
system to such a low level that there is
not enough
blood in the peripheral vessels to
create peripheral
vascular pressures high enough to
push the blood back to the heart.
42
Slide43ACUTE VENOUS DILATION
.
On some occasions, the peripheral veins become acutely vasodilated. This results most often when the sympathetic nervous system suddenly becomes inactive. For instance, fainting often results from sudden loss of sympathetic nervous system activity, which causes the peripheral
capacitative
vessels, especially the veins, to dilate markedly. This decreases the filling pressure of the vascular system because the blood volume can no longer create adequate pressure in the now flaccid peripheral blood vessels. As a result, the blood “pools” in the vessels and does not return to the heart.
43
Slide443.
Obstruction of the large veins
. On
rare occasions, the large veins leading into the heart become obstructed, so that the blood in the peripheral vessels cannot flow back into the heart. Consequently, the cardiac output falls markedly.
4.
Decreased tissue mass
,
especially decreased skeletal muscle mass
. With normal aging or with prolonged periods of physical inactivity, there is usually a reduction in the size of the skeletal muscles. This, in turn, decreases the total oxygen consumption and blood flow needs of the muscles, resulting in decreases in skeletal muscle blood flow and cardiac output. Regardless of the cause of low cardiac output, whether it be a peripheral factor or a cardiac factor, if ever the cardiac output falls below that level
required for
adequate nutrition of the tissues, the person is
said to
suffer
circulatory shock.
This condition can be lethal within a few minutes to a few hours.
44
Slide4545