
5 122 98 81 71 Å 122 98 81 71 lipidfree lipidbound M 1 2 3 4 5 A B 657 609 583 887 1092 947 932 573 Å Suppl Fig 1 415 native gradient gel ID: 1006607
Download Presentation The PPT/PDF document "M 1 2 3 4" is the property of its rightful owner. Permission is granted to download and print the materials on this web site for personal, non-commercial use only, and to display it on your personal computer provided you do not modify the materials and that you retain all copyright notices contained in the materials. By downloading content from our website, you accept the terms of this agreement.

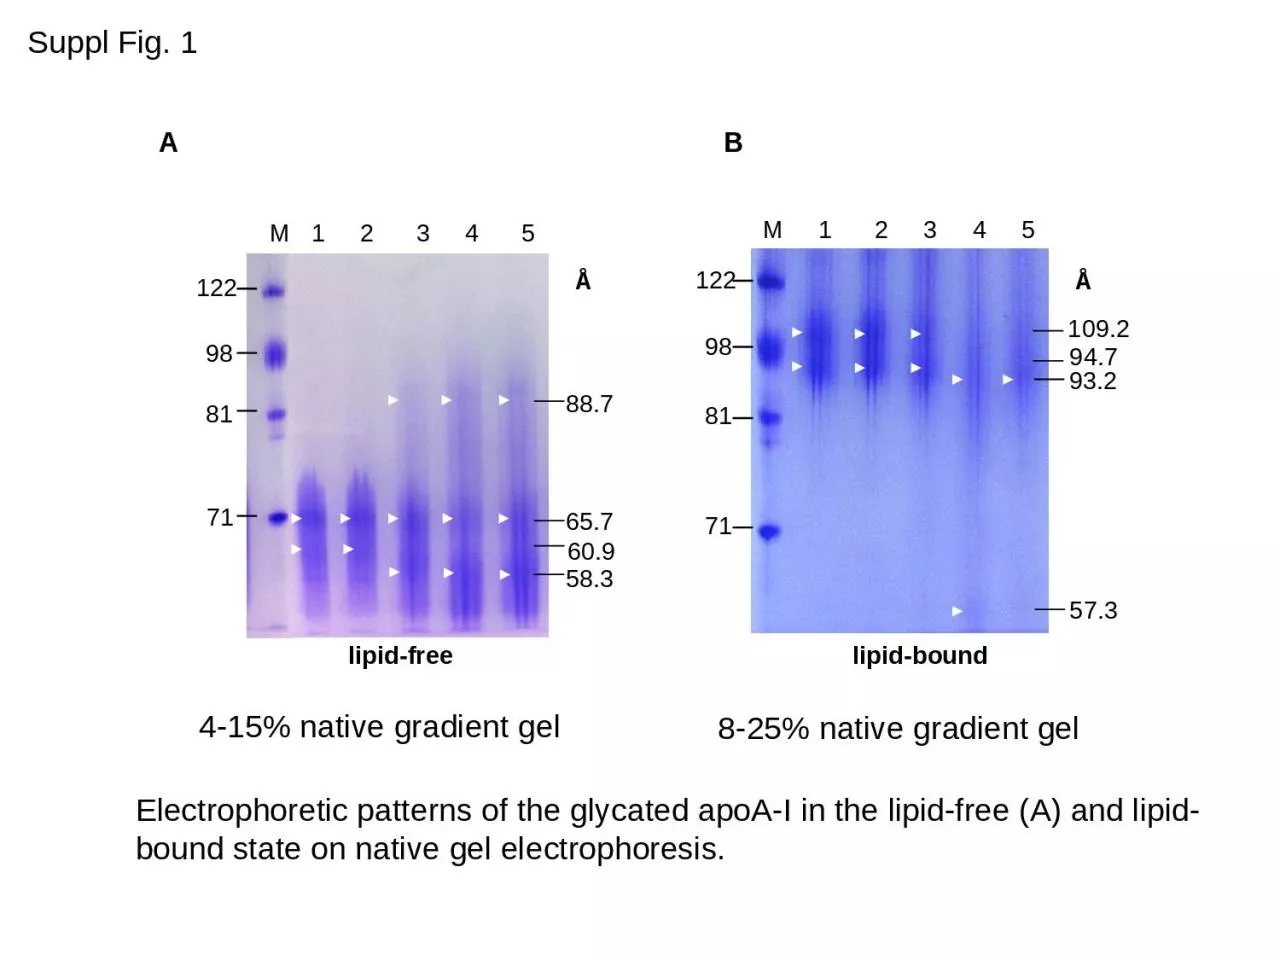
1. M 1 2 3 4 5122988171Å122988171lipid-freelipid-boundM 1 2 3 4 5AB65.760.958.388.7109.294.793.257.3ÅSuppl Fig. 14-15% native gradient gel8-25% native gradient gelElectrophoretic patterns of the glycated apoA-I in the lipid-free (A) and lipid-bound state on native gel electrophoresis.
2. ABSuppl. Fig. 2Circular dichroism spectra with keto hexose treated apoA-I in lipid-free (A) and lipid-bound state (B).f-A-I, fructose treated apoA-I; t-A-I,tagatose treated apoA-I; p-A-I psicose treated apoA-I