
October 2020 x0000x00002 xMCIxD 0 xMCIxD 0 Considering that the Cherenkov Telescope Array is a diverse collaboration with more than 1500 members whose work reaches the public w ID: 940954
Download Pdf The PPT/PDF document "x0000x00001 xMCIxD 0 xMCIxD 0 BestPract..." is the property of its rightful owner. Permission is granted to download and print the materials on this web site for personal, non-commercial use only, and to display it on your personal computer provided you do not modify the materials and that you retain all copyright notices contained in the materials. By downloading content from our website, you accept the terms of this agreement.


��1 &#x/MCI; 0 ;&#x/MCI; 0 ;BestPractices for Color BlindFriendly Publications and DescriptionsAstrodiversity Project October 2020 ��2 &#x/MCI; 0 ;&#x/MCI; 0 ;Considering that the Cherenkov Telescope Array is a diverse collaboration with more than 1,500 members, whose work reaches the public worldwide, and keeping in mindthe principles of CTA’s Astrodiversity project, we encourage all CTA members to keep the following bestpractices selecting suitablepatterns andcolor palettes for the publication of scientificand outreachplots in papers, posters and presentations, as well as to provide inclusive description Use different shapes/markersfor your data points (circles, squares, triangles…)as well as different line styles (solid, dashed, dot dashed lines…; Figure ). In case of pie chartsor histograms, fill each section with some patterns(Figure Figure Example of markers (left) and line styles (right) available on MatplotlibFigure Example of a pie chart showing different patterns. Created on Matplotli ��3 &#x/MCI; 2 ;&#x/MCI; 2 ;3. When giving an oralor writtendescription, avoid describing the results of a plot based only on the color and use the shapes instead (e.g. “the dashed line represents…,” instead of “the green line represents…”). If that is not possible (e.g. with skymaps), try to use color blind friendly palettes (see Point 3). In Matplotlib, usecoloblind friendly colormap, such asthe default “viridisor the new ividis(Figure upper panel) and avoid those already known for being problematic (e.g., “jet”Apply the same rule for colocycles: in this case, you can set the Matplolib style“tableaucoloblind10” or “seaborncoloblind” (Figure bottom panel). See Section Figure . CVD friendly colormaps(upper panel: “viridis” on the left and “cividis” on the right) and colorcycles(bottom panel: “tableaucoloblind10” on the left and “seaborncolorblind” on the right). ividisis a new colormapcreated with the aim of providing the same color view to all users, regardless of whether or not they havesome type ofredgreen colour blindness. It was created based on simulations from iridissee Nuñez J. R. et aSection ). ��4 &#x/MCI; 2 ;&#x/MCI; 2 ;5. Findan appropriate color palettewith online tools, such as ColorBrewer2.0 . Check if your plot is understandable for everybody with online color blindness simulators, like the one you can find at www.colorblindness.com (more information about CVD also included) II.Support Material and ReferencesMatplotlib uses by default a style with the color blind friendly colormap&
#147;viridis.” In order tochange the colormapto “cividis,” you can simply add the option cmap= ‘cividis’to your code. The default style, however, does not use a CVD friendly colorcycleand hence, to change it to “tableaucoloblind10” or “seaborncoloblind”, you need to load the following packages:Matplotlib Markers Matplotlib LineStyle Matplotlib Hatch Demo Nuñez J.R., Anderton C.R., Renslow R.S. (2018), “Optimizing color maps with consideration for color vision deficiency to enable accurate interpretation of scientific data.”PLoSONE 13(7): e0199239. https://doi.org/10.1371/journal.pone.0199239 Color Blindness simulator and CVD information: https://www.colorblindness.com/ Automatic color palette online creator: https://colorbrewer2.org/ https://towardsdatascience.com/twosimplestepstocreatecolorblindfriendlydata visualizations2ed781a167ec ContactAlba FernándezBarral , CTAO Outreach and Education Coordinator. ��3 When giving an oralor writtendescription, avoid describing the results of a plot based only ohe color and use the shapes instead (e.g. “the dashed line represents…,” instead of “the greenline represents…”). If that is not possible (e.g. with skymaps), try to use color blind friendlypalettes (see Point 3 n Matplotlib, usecoloblind friendly colormaps, such asthe default “viridis” or the newividis(Figure 4 – upper panel) and avoid those already known for being problematic (e.g.,“jet”Apply the same rule for colorcycles: in this case, you can set the Matplolib style“tableaucoloblind10” or “seaborncoloblind” (Figure 4 – bottom panel). See Section Figure . CVD friendly colormaps(upper panel: “viridis” on the left and “cividis” on the right) and colorcycles(bottom panel: “tableaucoloblind10” on the left and “seaborncolorblind” on the right). “cividisis a new colormapcreated with the aim of providing the same color view to all users, regardless of whether or not they havesome type ofredgreen colour blindness. It was created based on simulations from iridis” (see Nuñez J. R. et al. - Section ). ��2 Considering that the Cherenkov Telescope Array is a diverse collaboration with more than 1,500 members, whose work reaches the public worldwide, and keeping in mindthe principles of CTA’s Astrodiversity project, we encourage all CTA members to keep the following bestpractices selecting suitablepatterns andcolor palettes for the publication of scientificand outreachplots in papers, posters and presentations, as well as to provide inclusive descriptions: Use different shapes/m
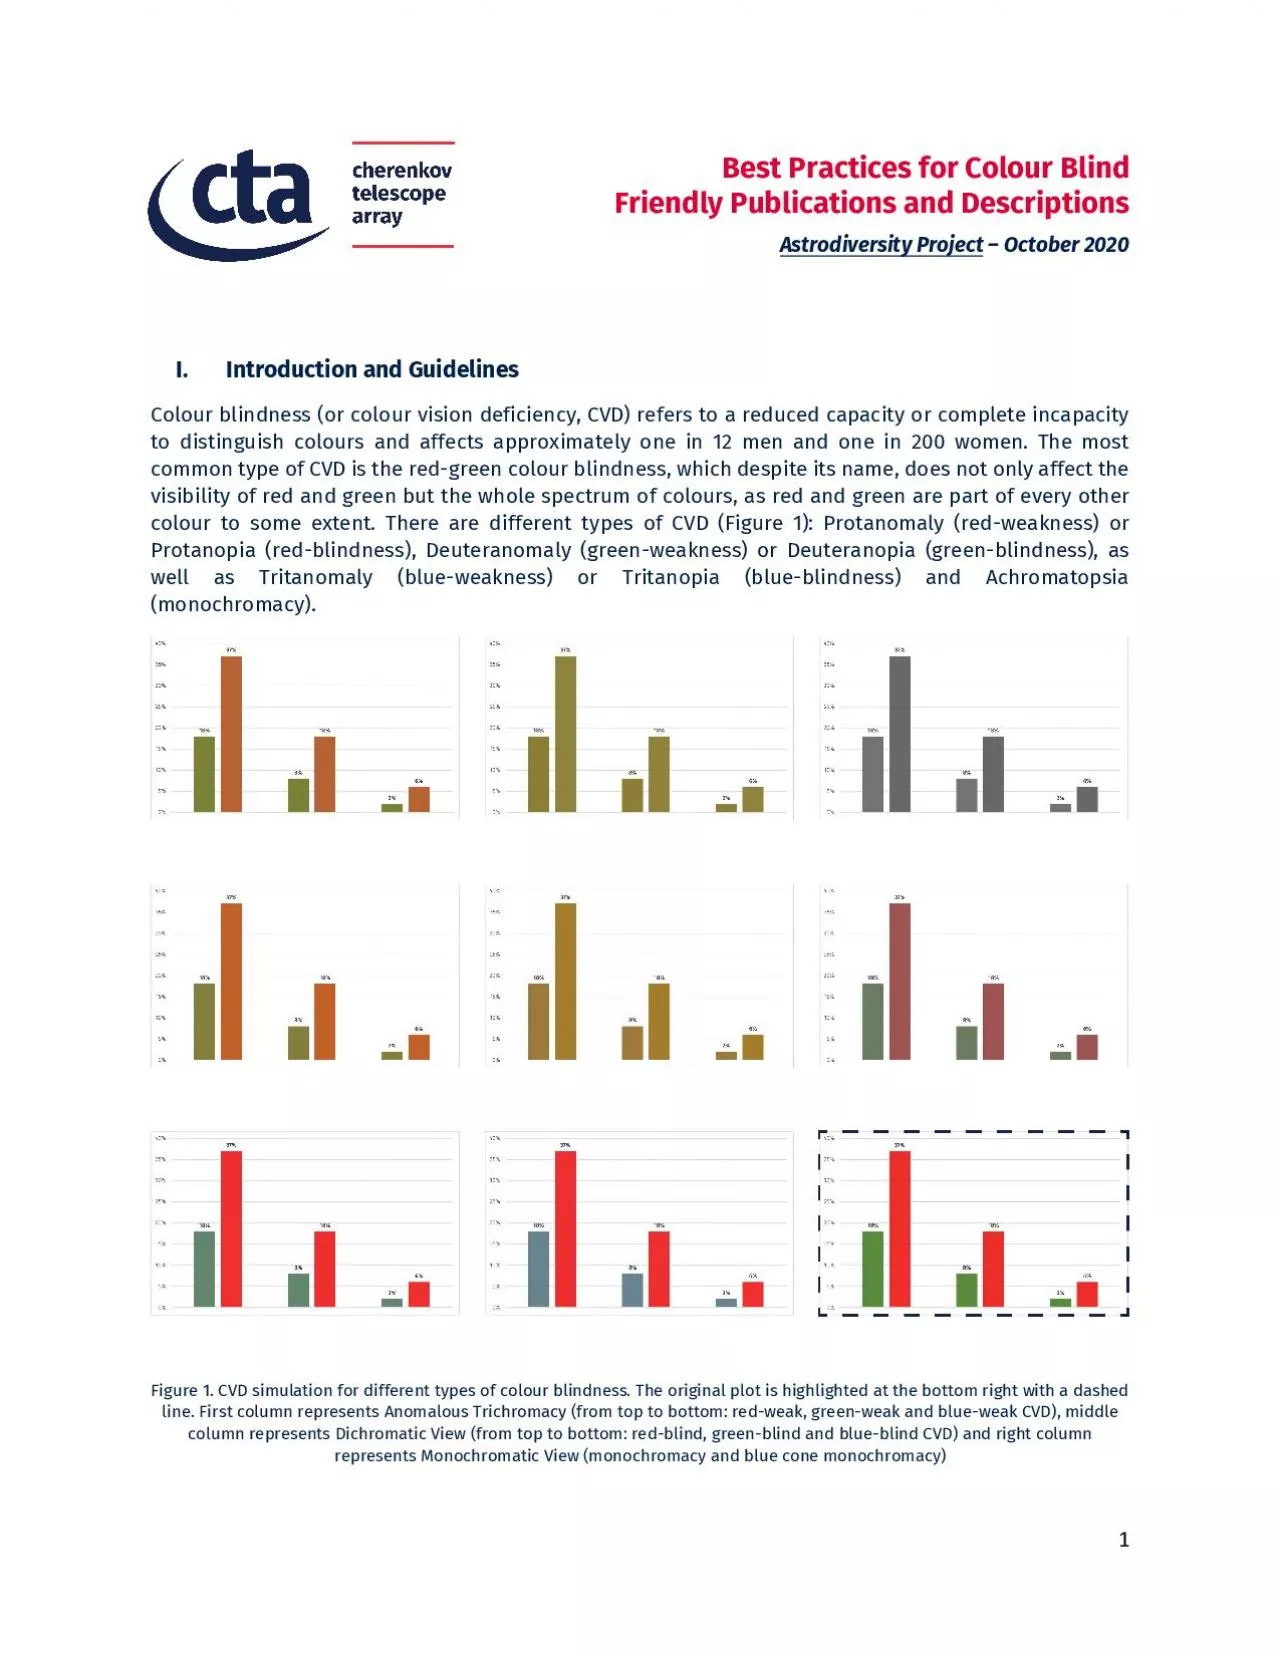
arkersfor your data points (circles, squares, triangles…), as well asdifferent line styles (solid, dashed, dot dashed lines…; Figure ). In case of pie charts orhistograms, fill each section with some patterns(Figure Figure Example of markers (left) and line styles (right) available on Matplotlib. Figure Example of a pie chart showing different patterns. Created on Matplotli ��1 BestPractices for Color BlindFriendly Publications and DescriptionsAstrodiversity Project – October 2020 ntroduction and GuidelinesColour blindness (or color vision deficiency, CVD) refers to a reduced capacity or complete incapacity to distinguish colours andaffects approximately onein 12 men and onein 200 women. The most common type of CVD is the redgreen color blindness, which despite its name, does not only affect the visibility of red and green but the whole spectrumof colours, as red and greenare part of every other color to some extent. There are different types of CVD(Figure 1)Protanomaly(redweakness) or Protanopia (redblindness), Deuteranomaly (greenweakness) or Deuteranopia (greenblindness), as well as Tritanomaly (blueweakness) or Tritanopia (blueblindness) and Achromatopsia (monochromacy). Figure CVD simulation fordifferent types of colour blindness. The original plot is highlighted at the bottom rightwith a dashed line. First column represents Anomalous Trichromacy(from top to bottom: redweak, greenweak and blueweak CVD), middle column represents Dichromatic View(from top to bottom: redblind, greenblind and blueblind CVD) and right column represents Monochromatic View(monochromacy and blue cone monochromacy) ��3 ” or 4 – Figure . CVD friendly colormaps(upper panel: “viridis” on the left and “cividis” on the right) and colorcycles(bottom panel: “tableaucoloblind10” on the left and “seaborncolorblind” on the right). “cividisis a new colormapcreated with the aim of providing the same color view to all users, regardless of whether or not they havesome type ofredgreen colour blindness. It was created based on simulations from iridis” (see Nuñez J. R. et al. - Section ). ��4 Find appropriate colour palette with online tools, such as ColorBrewer2.0.Check if your plot is understandable for everybody with online colour blindness simulators, likethe one you can find at www.color-blindness.com (more information about CVD also included) II.Support Material and ReferencesMatplotlib uses by default a style with the color blind friendly colormap“viridis.” In order tochange the colormapto “cividis,” you can simply add the option cmap= ‘cividis’to yourcode. The default style,
however, does not use a CVD friendly colorcycleand hence, to changeit to “tableaucoloblind10” or “seaborncoloblind”, you need to load the following packages: import matplotlib.style as style style.use('tableau-colorblind10') or import matplotlib.style as style style.use('seaborn-colorblind') atplotlib Markers Matplotlib LineStyle Matplotlib Hatch Demo Nuñez J.R., Anderton C.R., Renslow R.S. (2018), “Optimizing color maps with consideration forcolor vision deficiency to enable accurate interpretation of scientific data.”PLoSONE 13(7):e0199239. https://doi.org/10.1371/journal.pone.0199239 Color Blindness simulator and CVD information: https://www.colorblindness.com/ Automatic color palette online creator: https://colorbrewer2.org/ https://towardsdatascience.com/twosimplestepstocreatecolorblindfriendlydata visualizations2ed781a167ec ntactAlba FernándezBarral , CTAO Outreach and Education Coordinator. ��1 BestPractices for Color BlindFriendly Publications and Descriptions AstrodiversityrojectOctober020 Introduction and GuidelinesColour blindness (or color vision deficiency, CVD) refers to a reduced capacity or complete incapacity to distinguish colours andaffects approximately onein 12 men and onein 200 women. The most common type of CVD is the redgreen color blindness, which despite its name, does not only affect the visibility of red and green but the whole spectrumof colours, as red and greenare part of every other color to some extent. There are different types of CVD(Figure 1)Protanomaly(redweakness) or Protanopia (redblindness), Deuteranomaly (greenweakness) or Deuteranopia (greenblindness), as well as Tritanomaly (blueweakness) or Tritanopia (blueblindness) and Achromatopsia (monochromacy). Figure CVD simulation fordifferent types of colour blindness. The original plot is highlighted at the bottom rightwith a dashed line. First column represents Anomalous Trichromacy(from top to bottom: redweak, greenweak and blueweak CVD), middle column represents Dichromatic View(from top to bottom: redblind, greenblind and blueblind CVD) and right column represents Monochromatic View(monochromacy and blue cone monochromacy) ��3 ” or 4 – Figure . CVD friendly colormaps (upper panel: “viridis” on the left and “cividis” on the right) and colorcycles (bottom panel: “tableau-coloblind10” on the left and “seaborn-colorblind” on the right). “cividisis a new colormapcreated with the aim of providing the same color view to all users, regardless of whether or not they havesome type ofredgreen colour blindness. It was created based on simulations from iridis” (see Nuñez J. R. et al. - Section ).