
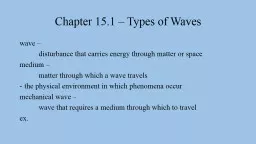
Wave Ratios and MeasurementsLength of Wave 2Length of Wave 3Length of Wave 4Length of Wave 1Length of Wave 5eSignal Part 2 Applying Technical Analy ID: 871338
Download Pdf The PPT/PDF document "Chapter 10 ..." is the property of its rightful owner. Permission is granted to download and print the materials on this web site for personal, non-commercial use only, and to display it on your personal computer provided you do not modify the materials and that you retain all copyright notices contained in the materials. By downloading content from our website, you accept the terms of this agreement.


1 Chapter 10
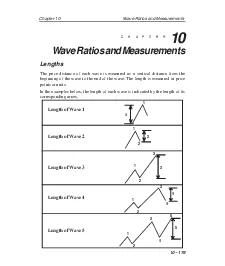
Chapter 10 Wave Ratios and Measurements 10~ 179points or units.In the examples below, the length of each wave is indicated by the length of itscorresponding arrow. Wave Ratios and Measurements Length of Wave 2Length of Wave 3Length of Wave 4Length of Wave 1Length of Wave 5 eSignal, Part 2
2 Applyi
Applying Technical AnalysisThe Fibonacci sequence is the work of Leonardo Fibonacci, circa 1180 CE. The1 - 1.618 - 2.618 - 4.23 - 6.85 (multiples)0.14 - 0.25 - 0.38 - 0.5 & 0.618 (ratios)listed below. These deviated ratios best fit the short-term wave pattern.Wave 1. The measure
3 ment of Wave 1 isFibonacci Rule for Wave
ment of Wave 1 isFibonacci Rule for Wave 2:Wave 2 is always related to Wave 1.Common Ratios for Wave 2:Wave 2 = either 50% of Wave 1 or 62% of Wave 1 of Wave 1 Length of Wave One } 50% 262% Chapter 10 Wave Ratios and Measurements 10~ 181Wave 3 is related to Wave 1 by one of the following:Wave 3 = either 1
4 .62 x length of Wave 1or 2.62 x length
.62 x length of Wave 1or 2.62 x length of Wave 1or 4.25 x length of Wave 1The most common multiples are 1.62 and 2.62. However, if the 3 Wave is anWave 4 is related to Wave 3 by one of the following:Wave 4 = either 24% of Wave 3or 38% of Wave 3or 50% of Wave 3The 24% and 38% are the most common ratios for Wave 4. Lengthof Wave 1Wave One 13 Length of Wave 3
5 of Wave 3 2 eSignal, Part 2
of Wave 3 2 eSignal, Part 2 Applying Technical AnalysisWave 5 has two different relationships. Both are shown below.If Wave 3 is greater than 1.62 or extended, then Wave 5 ratios are asWave 5 either= Wave 1 or= 1.62 x Wave 1 or= 2.62 x Wave 1If Wave 3 is less than 1.62, Wave 5 ratios are as follows:When
6 Wave 3 is less than 1.62, Wave overext
Wave 3 is less than 1.62, Wave overextends itselfthe ratio of Wave 5 will be based on the entire length from the beginning of Wave1 to the top of Wave 3.Extended Wave 5= either 0.62 x length(beginning of Wave 1 to top of Wave 3) or(beginning of Wave 1 to top of Wave 3) or= 1.62 x length of(beginning of Wave 1 to top of Wave 3) 5 based on length of 1 1
7 2 345 5 based on length of 1
2 345 5 based on length of 1 3 Chapter 10 Wave Ratios and Measurements 10~ 183Elliott Channels for Top of a Wave 5 Wave starts, the Elliott Channel Technique can be used to project Wave. Once Wave 4 has been completed, draw a straight linebetween Waves 2 and 4.Waves 1and 3.Expect Wave 5 to
8 end on one of the two upper channel lin
end on one of the two upper channel lines. Usually, if Wave 3was a normal wave, Wave 5 tends to end on the channel drawn from the Wave3 top. If Wave 3 was extended and a runaway type of wave, Wave 5 tends toend on the channel drawn from the top of Wave 1. Lower LowerWave 1 Upper eSignal, Part 2 Ap
9 plying Technical AnalysisStatistical Ana
plying Technical AnalysisStatistical Analysis of Wave 2 Ratios 38% retracement of Wave One 1215% Retraced below the 62% level 62%2 150% 1 Chapter 10 Wave Ratios and Measurements 10~ 185 Figure 10-1: Daily Chart, AlcoaIn the Alcoa Inc. (AA) chart above, Wave 2 retraced between 50% and 62% ofWave 1. eSignal,
10 Part 2
Part 2 Applying Technical AnalysisStatistical Analysis of Wave 3 RatiosLess than 3 = 1 12 3 12 1.75 X 11.6 X 145% of the time } 1.75 X 123 15% of thetime 3 122Greater than 2.62 X 18% of the time3 Chapter 10 Wave Ratios and Measurements 10~ 187Figure 10
11 -2: Daily Chart, Alcoa In the Alcoa In
-2: Daily Chart, Alcoa In the Alcoa Inc. (AA) chart above, Wave 3 wound up between 1.618 and 2.618of Wave 1. eSignal, Part 2 Applying Technical AnalysisStatistical Analysis of Wave 4 Ratios Retrace 24-30% of Wave 3 Wave 3 60% of the time Wave 3 15% of the time 30% Chapter 10
12 Wave Ratios and Mea
Wave Ratios and Measurements 10~ 189 Figure 10-3: Daily Chart, AlcoaIn the Alcoa Inc. (AA) chart above, Wave 4 retraced between 24% and 38% ofWave 3. eSignal, Part 2 Applying Technical AnalysisElliott / Fibonacci RatiosExtended if Wave 3 is less than 1.62 X Wave One5 =.62 X Length of
13 0 to 35 =1 X Length of 0 to 35 =1.62 X L
0 to 35 =1 X Length of 0 to 35 =1.62 X Length of 0 to 3 301234 280002820028100284002830012345 ? Chapter 10 Wave Ratios and Measurements 10~ 191Elliott / Fibonacci Ratios for Wave 5Even when Wave 3 is extended, our research has found that the Wave 5 sequencewill often end inside the ratios calculated from 03
14 where 0 (Zero) is the start ofWave 1. T is the start ofWave 1. T")
where 0 (Zero) is the start ofWave 1. This is the start of the new Five-Wave sequence. The length of 03 isextended from the end of Wave 4.Wave 5 usually ends inside the windows of 62% of 03 and equal to 03 addedto the end of Wave 4. Figure 10-4: Daily Chart, Alcoa eSignal, Part 2 Applying Technical Ana