
ofhouseholdstobesurveyeditisalwaysdicultforsurveystocaptureperfectlytheverytopgroupsKennickell2009a4Lastthetop01wealthshareestimatedbyKopczukandSaez2004fromestatetaxreturnsisremarkablycloseinlevelandt ID: 883546
Download Pdf The PPT/PDF document "1Thecapitalizationmethodfacesanumberofpo..." is the property of its rightful owner. Permission is granted to download and print the materials on this web site for personal, non-commercial use only, and to display it on your personal computer provided you do not modify the materials and that you retain all copyright notices contained in the materials. By downloading content from our website, you accept the terms of this agreement.

1 1Thecapitalizationmethodfacesanumberofpo
1Thecapitalizationmethodfacesanumberofpotentialobstacles.Wecarefullydealwitheachofthemandprovidechecksshowingthatthemethodworkswellinpractice.First,notallassetsgeneratetaxableinvestmentincomeÑowner-occupiedhousesandpensions,inparticular,donot.Theseassetsarewellcoveredb
2 yanumberofsourcesandweaccountforthembyco
yanumberofsourcesandweaccountforthembycombiningtheavailableinformationÑsurveys,propertytaxespaid,pensiondistributions,wagesreportedontaxreturns,etc.Ñinasystematicmanner.Second,withinagivenassetclass,richerhouseholdsmighthavedi"erentratesofreturnsthantherestofthepopulat
3 ion,inparticularbecauseoftaxavoidance.We
ion,inparticularbecauseoftaxavoidance.Wehaveconductedalarge-scalereconciliationexercisebetweenincometaxandnationalaccountsdatatotrackunreportedincomeandweimputemissingwealth(e.g.,heldthroughtrusts)whennecessary.Wetheninvestigateallthesituationswherebothwealthandcapital
4 incomecanbeobservedatthemicrolevelÑinthe
incomecanbeobservedatthemicrolevelÑintheSurveyofConsumerFinances(SCF),matchedestateandindividualincometaxdata,andpubliclyavailabletaxreturnsoffoundations.Ineachcase,weÞndthatwithinasset-classrealizedreturnsaresimilaracrossgroups,andthattopwealthsharesobtainedbycapitali
5 zingincomeareveryclosetothedirectlyobser
zingincomeareveryclosetothedirectlyobservedtopsharesinbothlevelandtrend.Attheindividuallevel,therelationshipbetweencapitalincomeandwealthisnoisy,butthecapitalizationmethodworksnonethelessbecausethenoisecancelsoutwhenconsideringgroupsofthousandsoffamilies,whichiswhatmat
6 tersforourpurposes.2 ofhouseholdstobesur
tersforourpurposes.2 ofhouseholdstobesurveyedÑitisalwaysdi!cultforsurveystocaptureperfectlytheverytopgroups(Kennickell,2009a).4Last,thetop0.1%wealthshareestimatedbyKopczukandSaez(2004)fromestatetaxreturnsisremarkablycloseinlevelandtrendtotheoneweobtainuptothelate1970s,
7 butthenhardlyincreasesfrom1976to2000.Est
butthenhardlyincreasesfrom1976to2000.Estate-basedestimatesareobtainedusingthemortalitymultipliertechnique,wherebyindividualestatesareweightedbytheinverseofthemortalityrate(conditionalonageandgender)tocapturethedistributionofwealthamongtheliving.Theestate-basedestimates
8 ofKopczukandSaez(2004)assumeaconstantmorassumeaconstantmor")
ofKopczukandSaez(2004)assumeaconstantmortalitydi"erentialbetweenthewealthyandtheoverallpopulation.Weshowthatthemortalitydi"erentialhasinfactsharplyincreasedsincethelate1970s,explainingwhyestate-basedestimatesfailtouncovertherecentsurgeintopwealthshares.5Despiteourbeste
9 "ort,westressthatwestillfacelimitationsw
"ort,westressthatwestillfacelimitationswhenmeasuringwealthinequal-ity.Thedevelopmentoftheo previousstudies.Section8concludes.Thekeystepsoftheanalysisarepresentedinthetext, UScitizensaretaxableintheUnitedStatesevenwhenlivingabroad.In2011,about1.5millionnon- thetop0.1%sh
10 arereßectsariseoftopentrepreneurialincom
arereßectsariseoftopentrepreneurialincomeratherthanpurecapitalincome.However,theconcentrationofpurecapitalincomehasalsoincreasedsigniÞcantly.Theshareofcorporatedividendsearnedbythetop0.1%dividend-incomeearnerswas35%in1962;itis onesimplereason.TheUSincometaxcodeisdesign
11 edsothatcapitalincomeßowstoindi-vidualre
edsothatcapitalincomeßowstoindi-vidualreturnsforawidevarietyofownershipstructures,resultinginalargeamountofwealthgeneratingtaxableincome.Inparticular,dividendsandinterestearnedthroughmutualfunds,S-corporations,partnerships,holdingcompanies,andsometrustsendupbeinginclud
12 ingintheÒinterestÓandÒdividendsÓlinesoft
ingintheÒinterestÓandÒdividendsÓlinesoftheultimateindividualownerÕstaxreturn,justasincomefromdirectly-ownedstocksandbonds.Manyprovisionsinthetaxcodepreventindividualsfromavoidingtheincometaxtroughtheuseofwealth-holdingintermediariesorexoticÞnancialinstruments.Oneofthem
13 ostimportantoneistheaccumulatedearningst
ostimportantoneistheaccumulatedearningstaxÑinforcesince1921ÑleviedontheundistributedcorporateproÞtsdeemedtoberetainedfortaxavoidancepurposes(Elliott,1970).15Similarly,thepersonalholdingcompanytaxÑinplacesince1937Ñe"ectivelypreventswealthyindividualsfromavoidingtheincom
14 etaxbyretainingincomeinholdingcompanies.
etaxbyretainingincomeinholdingcompanies.Imputedinterestonzero-couponbondsistaxedlikeregularinterest.Ad-mittedly,notallassetsgeneratetaxableincome,andincentivestoreportincomehavechanged in2000.18Thismixedmethodsmoothsrealizedcapitalgains.19Giventhatthisthirdstrategy man
15 yregulationspreventhighincomeearnersfrom
yregulationspreventhighincomeearnersfromcontributinglargeamountstotheirtax-deferredaccounts,pensionwealthismoreevenlydistributedthanoverallwealth.Weallocate21Theamountofowner-occupiedhousingwealthintheFlowofFundsisusuallyabout100timesbiggerthantheamountofpropertytaxesp
16 aidintheNIPAs,thatis,theaveragepropertyt
aidintheNIPAs,thatis,theaveragepropertytaxrateisusuallyabout1%,seeAppendixTableA11.AccordingtotheSCF,however,propertytaxesareregressive:onaverageover1989-2013thee"ectivepropertytaxrateisequaltoabout1%forthefullpopulation,butaslittleas0.4%forhouseholds bondsistaxexempt,
17 ithasbeenreportedonindividualtaxreturnss
ithasbeenreportedonindividualtaxreturnssince1987.Before1987,weassumethatitisdistributedasin1987,with97%ofmunicipalbondsbelongingtothetop10%ofthewealthdistributionand32%tothetop0.1%.Taxexemptinterestmighthavebeenevenmoreconcentratedbefore1987whentoptaxrateswerehigher,bu
18 tthemarginoferrorislimited,asonaggregate
tthemarginoferrorislimited,asonaggregatetaxexemptbondsamountedtoonly0.5%-1.5%ofhouseholdwealthfrom1913tothemid-1980s.TheStatisticsofIncomedivisionatIRSalsoproducedtabulationsinthe1920sand1930sshowingthattaxexemptinterestwasalwaysaminorformofcapitalincome,eveninverytopb
19 rackets.Currencyandnon-interestdepositsÑ
rackets.Currencyandnon-interestdepositsÑwhichaccountforabout1%oftotalwealthtodayÑaswellasnon-mortgagedebtdonotgeneratetaxableincome(orreportablepayments)either.WeallocatetheseassetsacrossfamiliessoastomatchtheirdistributionintheSCF.2523SpeciÞcally,weassumethat60%ofpens
20 ionwealthbelongstocurrentpensionersand40
ionwealthbelongstocurrentpensionersand40%towageearners.Forpensioners,weassumethatpensionwealthisproportionaltopensiondistributions.Forwageearners,weassumethatitisproportionaltowagesbutexcludingtaxÞlerswithwageincomeinthebottom50%ofthewagedistribution,asonlyabout50%ofwa
21 geearnershaveaccesstopensions.Underthese
geearnershaveaccesstopensions.Undertheseassumptions,the of22.1%inourbaselineestimateÑin2012.Thiscorrectionshouldbeseenasalowerboundasitonlyaccountsforo"shoreportfolioequities,bonds,andmutualfundshares,disregardingo"shorerealestate,closelyheldbusinesses,derivatives,cash
22 ,etc.Aftersupplementingcapitalizedincome
,etc.Aftersupplementingcapitalizedincomesbyestimatesforassetsthatdonotgeneratetax-ableinvestmentincome,weeachyearcover100%oftheidentiÞablewealthofUShouseholds.Duetodatalimitations,imputationsarecruderpriorto1962.30Atthattime,however,pen-sionwealthwassmall,sothatthevast
23 majorityofhouseholdwealth(70-80%)didgenedidgene")
majorityofhouseholdwealth(70-80%)didgenerateinvestmentincome,thuslimitingthepotentialmarginoferror.Toobtainreliabletopwealth .Inthatcase,capitalincomeriWiwillbepositivelycorrelated " groupsandhasremainedßatovertime,sothatcapitalizingtaxableincomegeneratesthecorrecttopw
24 ealthshares.Testlinkingestatesandincome.
ealthshares.Testlinkingestatesandincome.TheÞrstsituationwherebothpersonalwealthandtaxableincomecanbeobservedatthemicrolevelismatchedestatesandincometaxdata.ThereisalongtraditionattheStatisticsofIncomeDivisionoftheIRSinvestigatingthelinkbetweenincomeandwealthusingsuchma
25 tchedestates-incomereturns;seenotablyJoh
tchedestates-incomereturns;seenotablyJohnsonandWahl(2004),RosenmerkelandWahl(2011),Johnsonetal.(2011),Johnsonetal.(2013),andBourneandRosenmerkel(2014).Here,werelyonpubliclyavailabledata:asampleofestatesÞledin1977Ñ80%ofwhichareforindividualswhodiedin1976Ñmatchedtothedec
26 edentsÕ1974individualtaxreturns(seeKopcz
edentsÕ1974individualtaxreturns(seeKopczuk,2007,foradetailedpresentationofthedata).Since weresolargethatin1980,theaveragerealwealthoftop0.01%families($44millioninconstant2010prices)washalfits1929value($87million).Ittookalmost60yearsfortheaveragerealwealthofthetop0.01%t
27 orecoverits1929valueÑwhichitdidin1988.Th
orecoverits1929valueÑwhichitdidin1988.TheseresultsconÞrmearlierÞndingsofadramaticreductioninwealthconcentration(KopczukandSaez(2004)) 37Asaresult,elderlyfamiliesarerelativelypoorertodaythanhalfacenturyago:theywereabouttwiceaswealthyasaverageinthe1960sbutarenowonly40%we
28 althierthanaverage.Whilewealthisgettingo
althierthanaverage.Whilewealthisgettingolderonaggregate,inthetop0.1%ofthedistributionwealthisgettingyounger:theshareoftop0.1%wealthheldbyelderlyhouseholdsislowerin2012(39%)thanin1962(46%).In1962,topwealthwassigniÞcantlyolderthanaverage,whiletodayit37USStatisticalAbstra
29 ct2012,PopulationTable62,onlineathttps:/
ct2012,PopulationTable62,onlineathttps://www.census.gov/compendia/statab/2012/tables/12s0062.pdffor2010numbersandhttp://www.census.gov/hhes/families/data/households.html iswealthofindividual qit)Sit=ritá(1"! Wedenote .01whenfractilepisthetop1%).Similarly,wedenoteshpWt=
30 Yt),thewealthaccumulationoffractilepcan,thewealthaccumulationoffractilepcan")
Yt),thewealthaccumulationoffractilepcanberewrittenasshpWt+1= Insteady-state,topwealthandincomesharesarestable,andrelativesavingratesarestable;iftherearenodi Õswealthsharewillreachanewsteadystate.Forexample,iftheincomeshareoftop1%wealthholdersdoubles,thenthetop1%wealth
31 sharewillalsodoubleinthelong-run,assumin
sharewillalsodoubleinthelong-run,assumingtheirsavingratedoesnotchange.Ifthesavingrateofthebottom90%decreasesrelativetotheaveragesavingrate,thenthelong-runbottom90%wealthsharewillfallevenifthebottom90%incomesharedoesnotchange. shp áWsáY.(6)Ifdqp�0,itisasifthesavi
32 ngratespoffractilepwereaugmentedbyafacto
ngratespoffractilepwereaugmentedbyafactor(1+dqp) 49Howcanweexplainthisdi"erence?Therearethreenotabledi"erencesintermsofdeÞnitionsbetweenourestimatesandtheSCFbaselineestimates.First,weusetaxunitswhiletheSCFuseshouseholdstodeÞneeachfractile.Thereareabout25%moretaxunitsth
33 anhouseholds(asunmarriedpartners,aparent
anhouseholds(asunmarriedpartners,aparentwithanadultchild,ortworoommateslivingtogetherformasinglehouseholdbuttwotaxunits).Sec-ond,theSCFandFlowofFundsaggregatesdi"erbyassetclass.50 usingtotallydi"erentsourcesandmethodsgivesfurthercredibilitytotheÞndingthatalargedecrease
34 inwealthconcentrationtookplaceintheÞrsth
inwealthconcentrationtookplaceintheÞrsthalfofthe20thcentury.However,thereisalargediscrepancyfortherecentperiodafter1976.Whileourestimatesshowasharpincreaseinwealthconcentrationsincethelate1970s,theestate-basedestimatesdisplayonlyamodestincreaseinthetop0.1%wealthsharesi
35 ncethe1970s.Asaresult,by2000(thelatestye
ncethe1970s.Asaresult,by2000(thelatestyearthetop0.1%estate-basedwealthshareisavailable),asigniÞcantgaphasopenedbetweenthetwoseries.Howcanweexplainthisdiscrepancy?Recallthattheestate-multipliermethodre-weightsestatetaxreturnsbasedontheinverseprobabilityofdeath.Theprobab
36 ilityofdeathisbasedonmortalitytablesbyag
ilityofdeathisbasedonmortalitytablesbyageandgenderalongwithacorrectiontotakeintoaccountthatthewealthylivelongerthantheaveragepopulation.InKopczukandSaez(2004),thecorrectivetermisobtainedfromexternaldataonmortalityratesofcollegegraduates(aroughproxyforthewealthy)relativ
37 etomortalityratesofthefullpopulationfrom
etomortalityratesofthefullpopulationfromBrownetal.(2002).KopczukandSaez(2004)usethesamecorrectionfactorsforallyearsherebyassumingthatthemortalitygradientbywealthhasnotchanged e!cientlyadministeraprogressivewealthtax.60Reducingwealthdisparity.Howcouldwealthdisparitybere
38 duced(oritsincreaseslowed)?Sincewealthin?Sincewealthin")
duced(oritsincreaseslowed)?Sincewealthinequalityisfueledbybothrisingincomeandrisingsavingrateinequality,policiesneedtoaddressbothtrends.Progressiveincometaxationcanreducewealthconcentrationbylimitingtheabilityofrichhouseholdstoaccumulatewealth.Estatetaxationiscriticalt
39 opreventself-madefortunesfrombecominginh
opreventself-madefortunesfrombecominginheritedwealth.Progressivewealthtaxationa"ectswealthinequalitybydiminishingtherateofreturnonwealthatthetop(seePiketty,2014,Chapters14and15foradetaileddiscussion).ThehistoricalexperienceoftheUnitedStatesandotherrichcountriessuggests
40 thatprogressivetaxationcanpowerfullya"ec
thatprogressivetaxationcanpowerfullya"ectincomeand58 pendixisorganizedas4ExcelÞles:(i)AppendixTablesA(ÞleAppendixTables(Aggregates).xlsx):presentsouraggregatese- Boserup,S.,Kopczuk,W.,andKreiner,C.2014.Intergenerationalwealthmobility:Evidencefromdanishwealthrecordsofth
41 reegenerations.UniversityofCopenhagenWor
reegenerations.UniversityofCopenhagenWorkingPaper.Bourne,J.andRosenmerkel,L.2014.Overthetop:Howtaxreturnsshowthattheveryricharedi"erentfromyouandme.StatisticsofIncome,IRSWorkingPaper.Bricker,J.,Dettling,L.,Henriques,A.,Hsu,J.,Moore,K.,Sabelhaus,J.,Thompson,J.,andWindle
42 ,R.2014.ChangesinU.S.familyÞnancesfrom20
,R.2014.ChangesinU.S.familyÞnancesfrom2010to2013:EvidencefromtheSurveyofConsumerFinances.BoardofGovernorsoftheFederalReserveSystem.Brown,J.,Liebman,J.,andPollet,J.2002.Estimatinglifetablesthatreßectsocioeconomicdi"erencesinmortality,pp.447Ð457.InM.FeldsteinandJ.Liebman
43 (eds.),TheDistributionalAspectsofSocialS,TheDistributionalAspectsofSocialS")
(eds.),TheDistributionalAspectsofSocialSecurityandSocialSecurityReform.UniversityofChicagoPress,ChicagoandLondon.Bryant,V.andGober,J.2013.Accumulationanddistributionofindividualretirementarrange-ments,2010.InternalRevenueService:StatisticsofIncomeBulletin,WashingtonD.C
44 .Chetty,R.,Friedman,J.,Leth-Petersen,S.,
.Chetty,R.,Friedman,J.,Leth-Petersen,S.,Nielsen,T.,andOlsen,T.2014a.Activevs.passivedecisionsandcrowd-outinretirementsavingsaccounts:EvidencefromDenmark.QuarterlyJournalofEconomics129:1141Ð1219.Chetty,R.,Hendren,N.,Kline,P.,andSaez,E.2014b.Whereisthelandofopportunity?t
45 he educationdi"erentialsinmortality.Amer
he educationdi"erentialsinmortality.AmericanJournalofEpidemiology129:919Ð933.ForbesMagazine2014.TheForbes400:TheRichestPeopleinAmerica.September,annualsince1982.Goldsmith,R.,Brady,D.,andMendershausen,H.1956.AStudyofSavingintheUnitesStates,volume3.PrincetonUniversityPre
46 ss,Princeton.Greenwood,D.1983.Anestimati
ss,Princeton.Greenwood,D.1983.AnestimationofUSfamilywealthanditsdistributionfrommicrodata,1973.ReviewofIncomeandWealth29:23Ð43.Henriques,A.2013.Arehomeownersindenialabouttheirhousevalues?Comparingownerpercep-tionswithtransaction-basedindexes.FederalReserveBoardofGovern
47 orsWorkingPaper.Henriques,A.andHsu,J.201
orsWorkingPaper.Henriques,A.andHsu,J.2013.Analysisofwealthusingmicroandmacrodata:AcomparisonoftheSurveyofConsumerFinancesandFlowofFundsAccounts.FederalReserveBoardofGovernorsWorkingPaper.Hollenbeck,S.andKahr,M.2014.Individualforeign-earnedincomeandforeigntaxcredit,2011
48 .InternalRevenueService:StatisticsofInco
.InternalRevenueService:StatisticsofIncomeBulletin,WashingtonD.C.B.Johnson(ed.)1994.CompendiumofFederalEstateTaxandPersonalWealthStudies.Number4Ð94.DepartmentofTreasury,InternalRevenueService,StatisticsofIncome.B.Johnson(ed.)2011.CompendiumofFederalEstateTaxandPersonal
49 WealthStudies,volume2.DepartmentofTreasu
WealthStudies,volume2.DepartmentofTreasury,InternalRevenueService,StatisticsofIncome.Johnson,B.andMoore,K.2008.Di"erencesinincomeestimatesderivedfromsurveyandtaxdata.IRSStatisticsofIncomeWorkingPaperSeries. 1941.TheNationalIncomeandItsComposition,1919Ð1938.NationalBure
50 auofEco-nomicResearch.Lampman,R.1962.The
auofEco-nomicResearch.Lampman,R.1962.TheShareofTopWealth-HoldersinNationalWealth,1922Ð56.PrincetonUniversityPress,Princeton.Li,G.andSmith,P.2009.NewEvidenceon401(k)BorrowingandHouseholdBalanceSheets.FEDSWorkingPaper,BoardofGovernorsoftheFederalReserveSystem.Lindert,P.2
51 000.ThreecenturiesofinequalityinBritaina
000.ThreecenturiesofinequalityinBritainandAmerica,pp.167Ð216.A.AtkinsonandF.Bourguignon(eds.),HandbookofIncomeDistribution,volume1.Elsevier/NorthHolland,Amsterdam;NewYork.Mian,A.,Rao,K.,andSufi,A.2014.Householdbalancesheets,consumption,andtheeconomic GAO-09-769.USSenat
52 e2008.Taxhavenbanksandustaxcompliance.St
e2008.Taxhavenbanksandustaxcompliance.Sta A. Top Wealth GroupsFull Population160,700,000$343,000100%Top 10% 16,070,000$660,000$2,560,00077.2%Top 1%1,607,000$3,960,000$13,840,00041.8%Top 0.1%160,700$20,600,000$72,800,00022.0%Top .01%16,070$111,000,000$371,000,00011.2%B.
53 Intermediate Wealth GroupsBottom 90%144
Intermediate Wealth GroupsBottom 90%144,600,000$84,00022.8%Top 10-1%14,463,000$660,000$1,310,00035.4%Top 1-0.1%1,446,300$3,960,000$7,290,00019.8%Top 0.1-0.01%144,600$20,600,000$39,700,00010.8%Top .01%16,070$111,000,000$371,000,00011.2%Table 1: Thresholds and average w
54 ealth in top wealth groups, 2012Notes: T
ealth in top wealth groups, 2012Notes: This table reports on the distribution of household in the United States in 2012 as obtained by capitalizing income tax returns. The unit is the family (either a single person aged 20 or above or a married couple, in both cases w
55 ith children dependents if any). Fractil. Fractil")
ith children dependents if any). Fractiles are defined relative to the total number of families in the population. Source s = S/Yqr + qAll1.8%0.5%10%0.9%9.0%Bottom 90%-0.4% Notes:Thetoppaneldepictstophouseholdwealthsharesusingthereportedwealth(solidline)andthecapital-i
56 zedincomes(dashedline)ofSurveyofConsumerofSurveyofConsumer")
zedincomes(dashedline)ofSurveyofConsumerFinancesrespondents.WealthincludesÞxedincomeclaims(savings,checking,moneymarket,andcallaccounts,certiÞcatesofdeposits,holdingsofsavingsbonds,directholdingoftaxablebonds,andholdingsoftaxablebondsthroughmutualfunds),corporateequiti
57 es(helddirectlyandthroughmutualfunds),bu,bu")
es(helddirectlyandthroughmutualfunds),businessassets,rentalrealestate,andmiscellaneousÞnancialassets.Itexcludesthenetvalueofowner-occupiedhousesandpensionwealth.FortheSCFofyeart,wealthismeasuredintbutcapitalincomeismeasuredinyeart"1.Sources:SCFmicro-data,seeAppendixTab
58 leC1.Thebottompaneldepictstopfoundationw
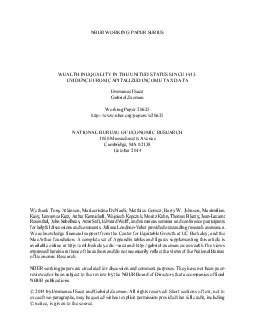
leC1.Thebottompaneldepictstopfoundationwealthsharesusingbalancesheetwealth(solidline)andfoundationsÕcapitalizedincomes(dashedline).Sinceincomefrombondsandstocksislumpedtogetheronform990-PF,weonlycapitalizedivi- Mortality (relative to full population) !"#$%&#'(#)(*#+,-$
59 .,/(01"-',-234(*3'4(0231(56789(top 10% t
.,/(01"-',-234(*3'4(0231(56789(top 10% top 5% top 1% Kopczuk-Saez The figure depicts the relative mortality rate for men aged 65-79 by wealth group and period. E.g., male top 1% wealth holders aged 65-79 mortality rate is 90% of males aged 65-79 population wide in 1979
60 -1984. Kopczuk-Saez is based on the mor
-1984. Kopczuk-Saez is based on the mortality of white college goers relative to population in the 1980s. The graph shows that the wealth mortality advantage increases overtime and more so for the top 1% wealthiest. Source: Appendix Figure C7. !"#$%"#$&"#$'""#$1979-19
61 84 1984-1988 1989-1993 1994-1998 1999-20
84 1984-1988 1989-1993 1994-1998 1999-2003 2004-2008 Mortality (relative to full population) !"#$%&#'(#)(*#+,-$.,/(01"-',-234(5#63'4(0231(789:;(top 10% top 5% top 1% Kopczuk-Saez The figure depicts the relative mortality rate for women aged 65-79 by wealth group and pe
62 riod. E.g., female top 1% wealth holders
riod. E.g., female top 1% wealth holders aged 65-79 mortality rate is 90% of females aged 65-79 population wide in 1979-1984. Kopczuk-Saez is based on the mortality of white college goers relative to population in the 1980s. The graph shows that the wealth mortality a
63 dvantage increases overtime and more so
dvantage increases overtime and more so for the top 1% wealthiest. Source: Appendix Figure C7. Figure15:MortalityGradientsbyWealthGroupNotes:Thetoptwopanelsreportthemortalityrateofmales(leftpanel)andfemales(rightpanel)bywealthgroupandagegroupsrelativetothefullpopulatio
64 ninthesamegenderandagegroup.TheKopczuk-S
ninthesamegenderandagegroup.TheKopczuk-SaezseriesisthemortalityrateofcollegegoersusedtocorrecttheestatemultipliersinKopczukandSaez(2004).Thetoppanelshowsthat,formales,themortalitycorrectionforthetop10%overallisveryclosetothemortalitycorrectionusedbyKopczukandSaez(2004)
65 .However,thisisaclearmortalitygradientwi
.However,thisisaclearmortalitygradientwithinthetop10%.Thetop10%livelesslongthanthetop1%whointurnlivelesslongthanthetop.1%.Computationsarebasedontaxdataforyears1999to2008.Thebottompanelsplotthemortalityratesbywealthgrouprelativetothefullpopulationformenaged65to79overtim