
Aiko Therese Landerito Bonifacio Sessa July 27 2008 Company Facts Committed to Health Quality Safety Licensees Sell and ship product Expenses Outside marketing support Licensing fees ID: 1017710
Download Presentation The PPT/PDF document "Imagination Farms, LLC Julie Conn" is the property of its rightful owner. Permission is granted to download and print the materials on this web site for personal, non-commercial use only, and to display it on your personal computer provided you do not modify the materials and that you retain all copyright notices contained in the materials. By downloading content from our website, you accept the terms of this agreement.


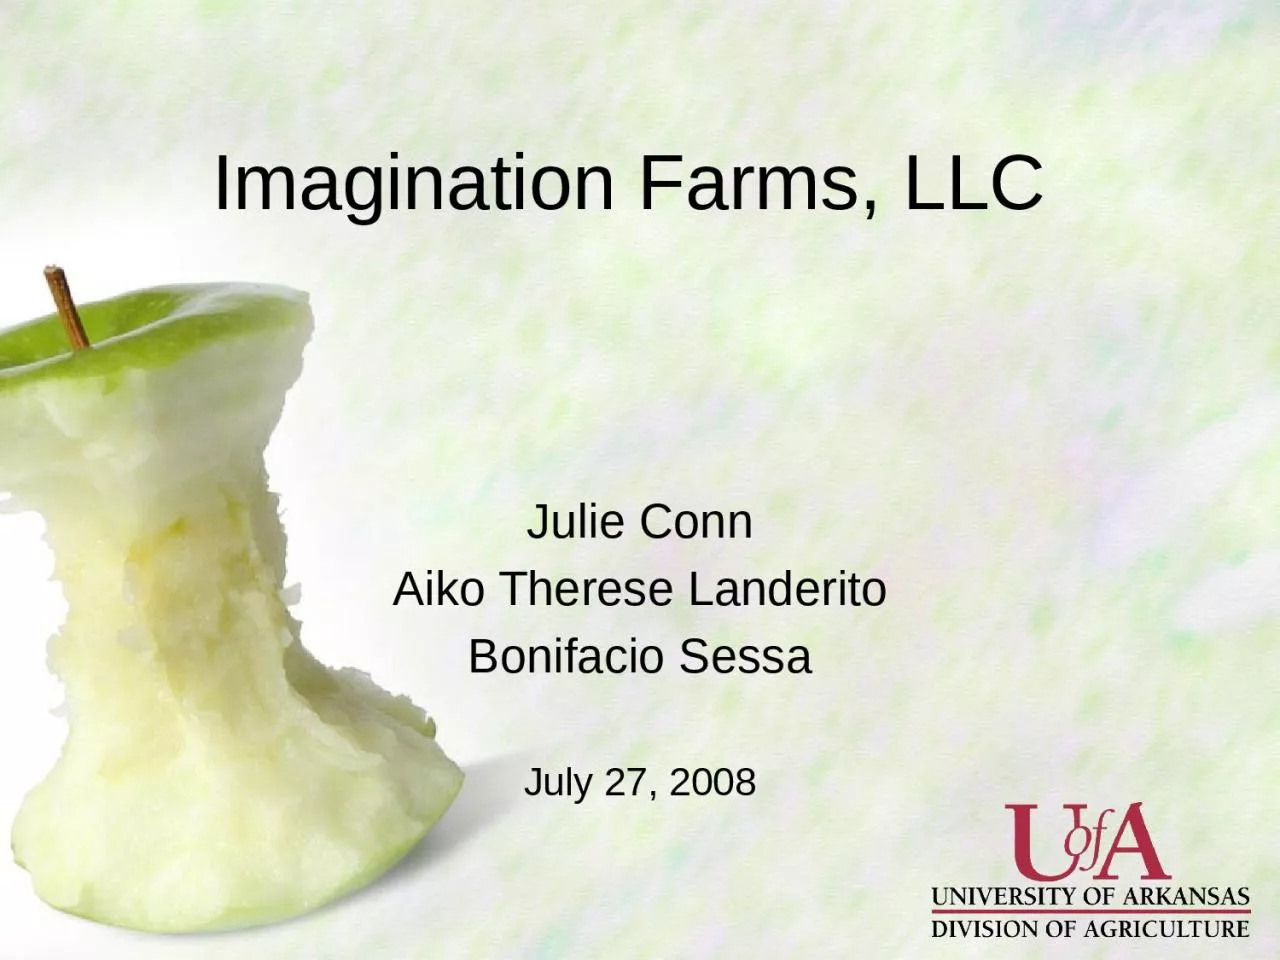
1. Imagination Farms, LLCJulie ConnAiko Therese LanderitoBonifacio SessaJuly 27, 2008
2. Company FactsCommitted to:HealthQualitySafetyLicensees: Sell and ship productExpenses: Outside marketing supportLicensing feesQuality control measuresRole:Support Disney’s social corporate responsibility“To increase the consumption of fruits and vegetables among children”InnovationIntegrity
3. Brand StrengthConsumers identify branded products excelling in: Quality and reliability Design PrestigeDisney BrandParents perceive brand as magical, high quality, and trust-worthyKids perceive brand as fun and popular among peersCompetition can’t match this brand image
4. Industry AssessmentProjected 2008 per capita consumption: 244.99 lbs19% of produce was branded in 2002Major Fruits: Berries, Apples, Grapes in 2006Major Vegetables: Tomatoes, Potatoes, Onions in 2006Fresh ProduceMarket Retail Share
5. Children’s Health ChallengeChallenge:1/3 of American children are obese or at risk to obesityCost of obesity related disease: $117 billion50% of children’s calories are from fat and added sugarTop three countries with childhood obesity: U.S., Mexico, United KingdomMarketing:Food, beverage, and candy industry annually spends $7.3 billion on direct media advertisingLess than 2% of food advertising promotes fruits and vegetablesResponse:5 A Day CampaignMore MattersTM
6. There is still a lack of consumer awareness
7. Awareness increasing but not enough action… need more convenience.
8. Marketing Food to ChildrenMarketing Categories by Population Sizesa – mean servingsApproximately 11 servings each day not being metCases per year: 271.5 millionSales per year: $4.1 billionLicense fee at 5%: $205 millionSales volume potential: 10.8 billion lbsGroupAge RangePopulation SizeAverage ConsumptionVegetablesFruitsInfants and Toddlers0-2 year11,416,6760.9 – 3.5a(combined consumption)Children3-8 years24,041,3070.9 – 3.3a(combined consumption)Tweens9-12 years16, 732, 3112.6a1.9aTeens13-19 years28, 282, 9713.6a1.9a
9. Marketing Food to Children (cont’d)“There was a gap between the foods children requested and the foods their mothers were willing to buy for them”Dual Marketing StrategyChildren: Attractive packaging Desirable taste FunParent: Convenience Nutritional value Competitively priced Product requested by childrenOpportunity to engage more aggressively in retail “pull” strategy vs. co-packer “push” strategy
10. InternalLimited ResourcesContract renewal and short term performance focusSmall market shareFood safetyLack of product visibility and commercial advertisingExternalMarket competitionComplacent consumer & co-packersInherent variation in commodity qualityRetailer-supplier Relationship Company Challenges
11. Position SummaryStrength – Disney brand & increased concern for child nutrition Weakness – Lack of product visibility & commercial advertisingOpportunities – Product differentiation & placement along with potential school accessThreats – Contract renewal & competition with other firms and brands
12. Strategic Recommendation1.) School / Parent ProgramEducation packetsKids Food Calendar / stickersParent Shopping listImplementationContact school boards about purchasing the packetsFind government grants for product placement in schoolsSingle serve packaging for school lunches (convenience and peer concept)Pre-packaged & pre-portioned
13. Strategic Recommendation2.) Expand Across Disney CompanyProvide fresh produce to Parks and ResortsHave Disney Garden cases available at restaurantsAdvertising of Disney Garden products to park visitorsImplementationUtilize relationship with Disney for continued support of Disney Garden
14. Strategic Recommendation3.) Retail StrategyCross-promotional sellingPromote spoilage and labor savings 10% ↓ spoilage = 1.3 to 1.5% ↑ in salesPrice and product differentiationWidespread product availabilityFrequent buyer coupons and contestsImplementationUse PLU stickers as a coupon for another Disney product (value added to fresh)Focus the main product line on staple products and differentiate the seasonal productsCreate a customer rewards cardI-Farms, co-packers should work in conjunction with test stores to identify spoilage and labor cost savings (consumer and retailer) 1852-773-9002
15. Projected Inventory Sales using the 80-20 ConceptProductRankProjected Sales($millions)ABC $MTomatoes123.28AApples217.94Berries314.25Grapes411.60$67.07Bananas59.62BPotatoes68.11Lettuce95.23Carrots104.60Oranges114.08Broccoli123.65Avocados133.28Cherries152.69Pineapple201.76Nectarines231.42$72.11Grapefruit261.17CLimes271.10Spinach320.83Greens330.79Eggplant340.75$17.32Totals $156.50 A = 35% of salesB = 56% of salesC = 9% of salesSource: Produce Marketing Association
16. Future RecommendationsProduct placement in Disney showsE.T. and the Reeses Pieces phenomenaFood Quality TechnologyPackaging RFID
17. Strategic SummaryEducational based School/Parent Program emphasizing nutrition and convenienceGrowth into Disney Parks & ResortsPull Retail Strategy to increase sales volumeConsider future recommendations for advertising and consistent quality assurance
18. Thank you!Questions, Comments
19. Strategic Recommendation3.) Retail StrategyCross-promotional sellingPromote spoilage and labor savings 10% ↓ (5 – 7%) & 8% = 1.3 to 1.5% ↑Price and product differentiationWidespread product availabilityFrequent buyer coupons and contestsImplementationUse PLU stickers as a coupon for another Disney product (value added to fresh)Focus the main product line on staple products and differentiate the seasonal productsCreate a customer rewards card in conjunction with test stores to identify spoilage and labor cost savings (consumer and retailer)
20.
21. Projected Inventory Sales using the 80-20 ConceptProductRankCumulative % of Total SalesCumulative % of Total ItemsCumulative Sales($million)Projected Sales($millions)ABC $MTomatoes110.27%2.22%23.27623.28AApples218.96%4.44%41.21917.94Berries327.58%6.67%55.47414.25Grapes435.56%8.89%67.07111.60$ 67.07Bananas542.97%11.11%76.6919.62BPotatoes650.24%13.33%84.7998.11Melons756.26%15.56%91.7266.93Lettuce965.78%20.00%102.9385.23Carrots1069.46%22.22%107.5394.60Oranges1172.88%24.44%111.6204.08Broccoli1275.10%26.67%115.2663.65Avocados1377.31%28.89%118.5423.28Cherries1581.02%33.33%124.1902.69Pineapple2088.40%44.44%134.6121.76Nectarines2391.90%51.11%139.1821.42$ 72.11Grapefruit2694.43%57.78%142.9141.17CLimes2795.22%60.00%144.0111.10Spinach3297.61%71.11%148.6450.83Greens3397.96%73.33%149.4310.79Eggplant3498.23%75.56%150.1800.75Parsnip45100.00%100.00%156.5000.46$ 17.32Totals $ 156.5
22. RFIDRFID – Radio Frequency IdentificationCollects readings indicating pH, humidity, and temperatureMonitors food quality throughout supply chainHelps reduce wasteLarge retailers require tags for main suppliersRetailers testing potential to improve distribution of fresh produce (Publix and Del Monte along with the University of Flordida)Could help differentiate product through cutting edge technology and aid in food quality measures
23. 80-20 Mathematical Computation Y = [(1 + A) X]/ [(A + X)] (eq.1) Where: Y= cumulative fraction of sales X=cumulative fraction of items A= a constant to be determined by manipulating (eq. 1): A = [(1 - Y) X]/ [(Y - X)] (eq. 2)For fresh fruits, 19% of the items (X= 19.05 %) results in 56% of the sales (Y=56.7%) A = [(1 – 0.56) 19]/ [(0.56 – 0.19)] = 0.219
24. If annual sales of I-farm shipment sales volume are expected to be $ 156.5 millions in 2010, how much inventory investment should be expected from I-farms co-packers?Applying the 80-20 concept on the Retail Fresh Produce Industry Sales of Sept 2007 for fresh produce items licensed by I-farms:20% of the items accounts for approximately 65% of the total sales.A= 0.1495The sale for the first item (Tomatoes) would be found multiplying equation 1 to $ 156.5 million: Y = [(1 + 0.1495) 0.0222]/ [(0.1495 + 0.0222)] * (156.5 million) = $ 23.25 million, AND given turn over ratios average inventories can be obtained for each product category by dividing the projected sales by the turn over value.
25. Relationship specific investment between I-Farms and co-packersDefine tactics to achieve competitive advantageReducing transaction and operating costProduct differentiation with supply-chain base through technology and innovationFocus on strategic performance measuresTotal Cost AcquisitionMarket GrowthGeographical decentralization of product placementRecall response implementation strategyAdvantage of traceability with brandingInternal
26. Product differentiationPrice and quantityBuilding good reputation between the supplier and the retailerLong-term commitmentsVisibleUnderstandableCredibleInformation SharingExternal
27. FruitsWal-MartHarpsIGARedDisney Garden ($/lb)No Brand ($/lb)No Brand ($/lb)Cherries3.684.995.49 PineappleDel-Monte (Each)Coast Tropical (Each)Cost Tropical (Each)(whole)3.935.992.49 GrapeDel-Monte (1-pint)3 Generations (1-pint)3 Generations (1-pint)Tomatoes1.983.993.49 BananaDole ($/lb)Dole ($/lb)Dole ($/lb)0.640.650.69Vegetables CeleryTanimura & Antle (16 oz)Ocean Mist (16 oz)Ocean Mist (16 oz)(Heart)1.962.492.99 SpinachFresh Express (6oz)Dole (6oz)Dole (6oz)2.882.892.99 Carrots Baby GGF (160z)Bolthouse Farms (16 oz) 1.691.89Fresh Fruit and Vegetable Price DifferentiationSource: Fayetteville, AR
28. Quantity Volume ApproachLow price to increase the volumes of salesCooperation in order to meet consumers preferencesUse of cost cutting tactics through the supply chainCompetitive advantage through cost reduction and by internalize social responsibility – values and environmental issuesStrategy Implementation80-20 concept:
29. Vegetable as Percentage of Total Vegetable Ads(July 18, 2008)Source: USDA; Agricultural Marketing Service
30. Fruit as Percentage of Total Fruit Ads(July 18, 2008)Source: USDA; Agricultural Marketing Service
31.
32. Industry Assessment (con’t)Fresh FruitsMajor Fruits(2006): Apples – $4,260 M Berries – $ 4,226 M Grapes – $3,911 MPer Capita Consumption (2005): 126.0 lbsProjected Production (2008): 22,437 M lbsFresh VegetablesMajor Vegetables (2006): Tomatoes - $4,393 M Potatoes - $3,201 M Onions - $2,336 MPer Capita Consumption (2005): 198.6 lbsProjected Production (2008): 101,692 M lbsTotal Acre Harvested: 1,250,830 acres
33. Produce Industry AnalysisThreat of EntryMarket ShareBrand StrengthInternal Rivalry Price rivalry between firms Variation between co-packers Existing number of firmsBuyer Power- Retailer and consumer negotiate purchase priceSupplier PowerPricing limited due to availability of substituteIncrease demand for FFVSubstitutes and Complements- Pricing should minimize the threat of substituteIncrease awareness to promote fresh produce- Political pressure
34. Company AnalysisOpportunitiesInternational ExpansionSelling out to DisneyProduct differentiationExpansion to Theme Parks/Resort*placement*growing awarenessThreatsBrand damage from food safetyContract renewalCompetition with other firms and brandsStrengthsAssociation with the Disney BrandBusiness ethics and child nutritionCustomer driven business model*relationship w/copackersWeaknessesLimited resourcesSmall firm compared to competitorsLack of commercial advertising*visibility
35. References:Ballou, R. H. 2003. Business Logistics/Supply Chain Management, 5th Edition. Prentice Hall Publishing.Besanko, D. et.al. 2006. Economics of Strategy. 4th Edition. Dennison, B.A, et.al. 1998. Fruit and Vegetable Intake in Young Children. Journal of the American College of Nutrition. Vol.17, No.4, 371-378Hampl, J.S. et.al. 1999. Intakes of Vitamin C, Vegetables and Fruits: Which School Children are at risk?. Journal of the American College of Nutrition. Vol.18, No.6, 582-590McGinnis, J. M. et. Al. 2006. Food Marketing to Children and Youth: Threat or Opportunity. National Academies Press. U.S.A.Produce for Better Health Foundation. 2007. National Action Plan to Promote Health through Increased Fruit and Vegetable Consumption.Produce Marketing Association. Retail Fresh Produce Industry Sales. Story M. and Simone French. 2004. Food Advertising and Marketing Directed at Children and Adolescents in the U.S. International journal of Behavioral Nutrition and Physical Activity. USDA. Agricultural Marketing Service. National Fruit and Vegetable Retail Report. Vol. 11, No. 29USDA. Per capita Consumption of Major Food Commodities. Table 9. http://www.ers.usda.gov.USDA. USDA Agricultural Baseline Projections to 2015. 2006. Baseline Report OCE-2006-1