
Gayer M Legros D Formenty P Connolly MA Conflict and Emerging Infectious Diseases Emerg Infect Dis 2007131116251631 httpsdoiorg103201eid1311061093 ID: 1009222
Download Presentation The PPT/PDF document "Figure Figure. Geographic distr..." is the property of its rightful owner. Permission is granted to download and print the materials on this web site for personal, non-commercial use only, and to display it on your personal computer provided you do not modify the materials and that you retain all copyright notices contained in the materials. By downloading content from our website, you accept the terms of this agreement.


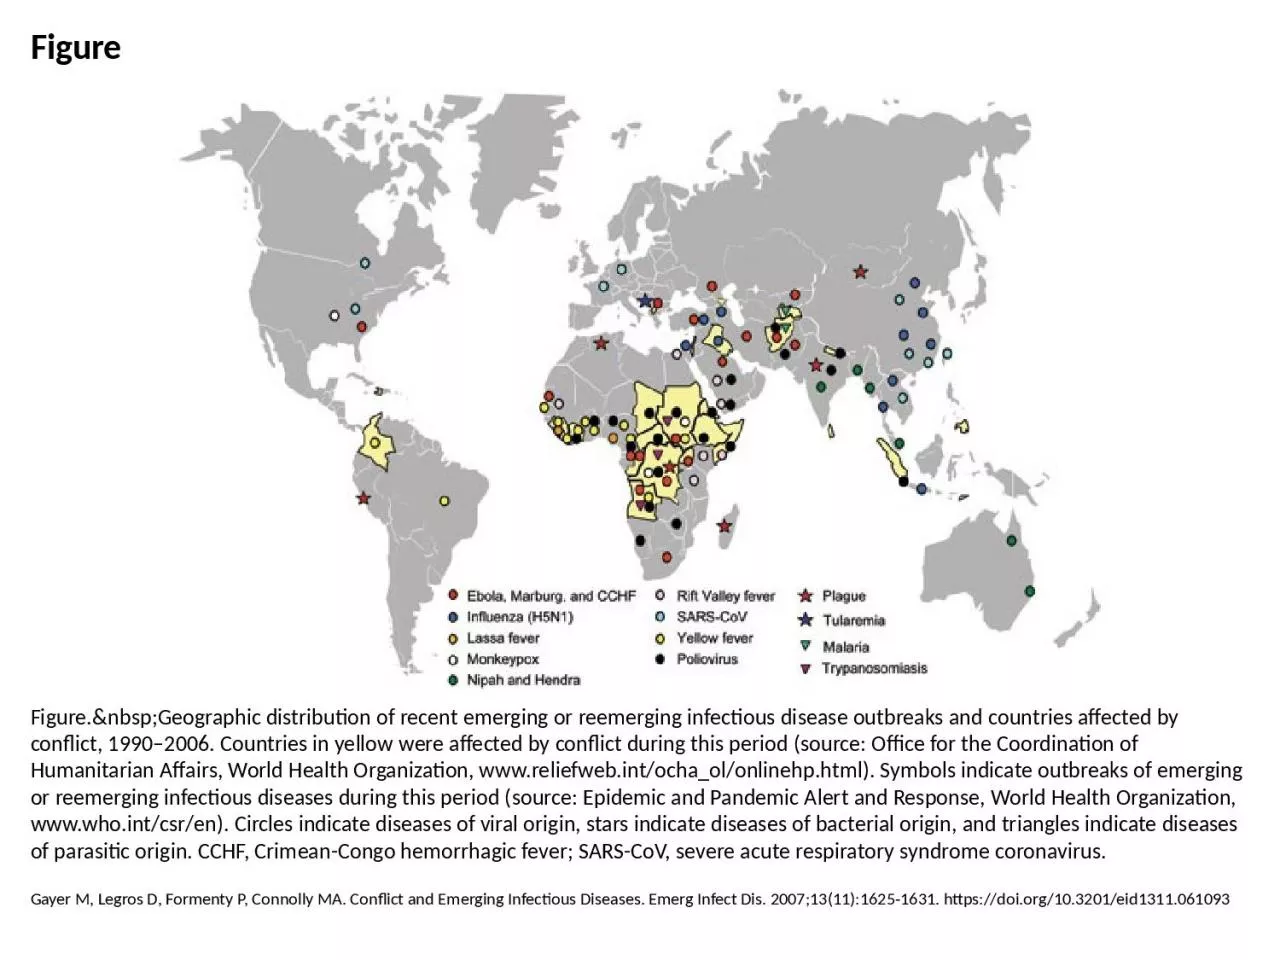
1. FigureFigure. Geographic distribution of recent emerging or reemerging infectious disease outbreaks and countries affected by conflict, 1990–2006. Countries in yellow were affected by conflict during this period (source: Office for the Coordination of Humanitarian Affairs, World Health Organization, www.reliefweb.int/ocha_ol/onlinehp.html). Symbols indicate outbreaks of emerging or reemerging infectious diseases during this period (source: Epidemic and Pandemic Alert and Response, World Health Organization, www.who.int/csr/en). Circles indicate diseases of viral origin, stars indicate diseases of bacterial origin, and triangles indicate diseases of parasitic origin. CCHF, Crimean-Congo hemorrhagic fever; SARS-CoV, severe acute respiratory syndrome coronavirus.Gayer M, Legros D, Formenty P, Connolly MA. Conflict and Emerging Infectious Diseases. Emerg Infect Dis. 2007;13(11):1625-1631. https://doi.org/10.3201/eid1311.061093