
The human tpi1 gene in NCBI The neighboring gene ubiquitin specific peptidase 5 is perhaps more typical vma 1 genes Saccharomyces cerevisiae S288C Schizosaccharomyces pombe Homo sapiens ID: 914736
Download Presentation The PPT/PDF document "MCB3421 class 23 Introns, Emboss, Compo..." is the property of its rightful owner. Permission is granted to download and print the materials on this web site for personal, non-commercial use only, and to display it on your personal computer provided you do not modify the materials and that you retain all copyright notices contained in the materials. By downloading content from our website, you accept the terms of this agreement.


Slide1
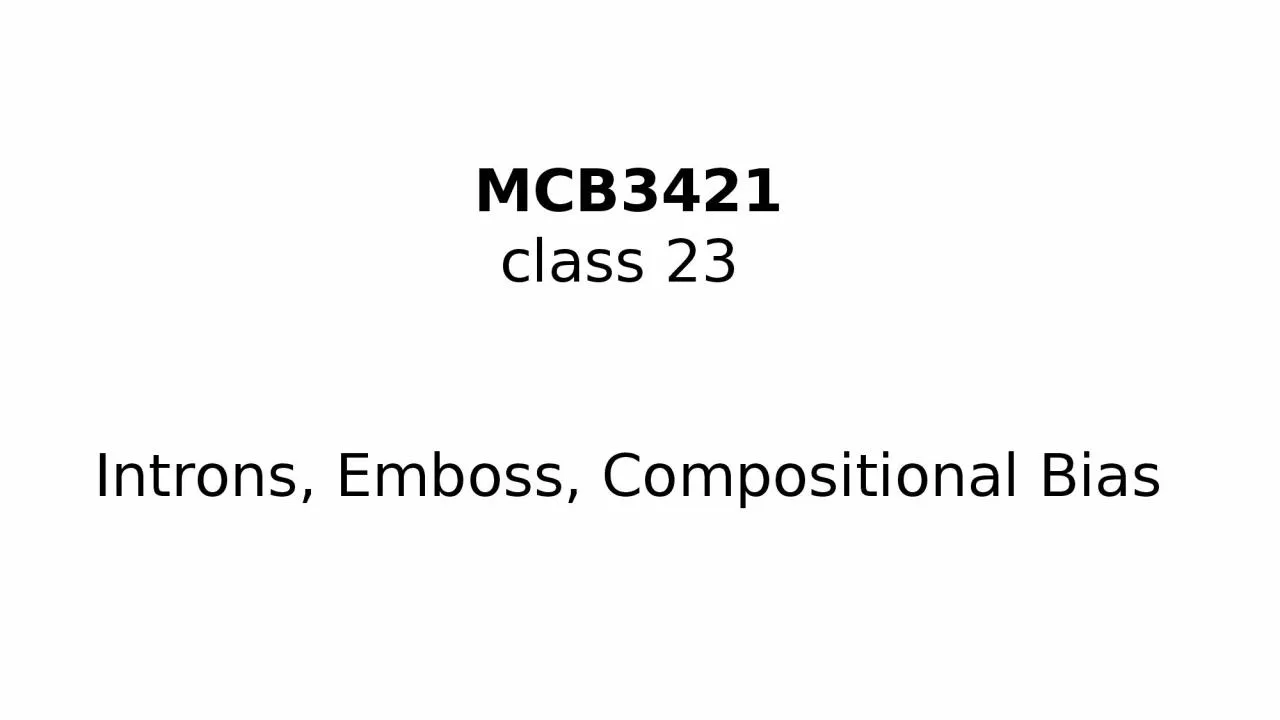
MCB3421
class 23
Introns, Emboss, Compositional Bias
Slide2The human tpi1 gene in NCBI
Slide3The neighboring gene,
ubiquitin specific peptidase 5,
is perhaps more typical:
Slide4vma
1 genes
Saccharomyces cerevisiae S288C
Schizosaccharomyces
pombe
Homo sapiens
(human)
Xenopus
laevis
(African clawed frog)
(one of two paralogs)
Slide5vma
1 genes
Arabidopsis thaliana
(
thale
cress)
Zea
mays
chromosome 4
Zea
mays
chromosome 5
Phalaenopsis
equestris (orchid)
Phoenix dactylifera
(date palm)
Slide6Splice site consensus in
Arabidopsis thaliana
Slide7Splice site consensus humans
From:
http://science.umd.edu/labs/mount/RNAinfo/matrices.html
https://pubmed.ncbi.nlm.nih.gov/9536098/
C A G || G T
Slide8Splice site consensus humans
A G || G T
From:
http://science.umd.edu/labs/mount/RNAinfo/matrices.html
https://pubmed.ncbi.nlm.nih.gov/9536098/
Slide9Predicting Intron and Exon sequences using computational approaches remains problematic.
The best way approach is to compare a cDNA or EST to the genome.
The second best is to compare the genome sequence to a protein databank.
The parts of the query that does not have matches corresponds to introns.
Note the large number of introns present in Arabidopsis, which is a plant with a very small genome. In other organisms the introns are even larger.
Slide10Predicting Open Reading Frames
GeneMark
uses hidden Markov models and can be trained using training sets
-- works for pro- and eukaryotes and metagenomes
--
GenemarkS
is the “standard to gene calling in viruses and prokaryotes
Glimmer
was developed for prokaryotes,
-- a related software (GlimmerHMM) was developed for eukaryotes
Keep in mind that ab initio approaches work less well than those based on homology. Popular are PROKKA
(described here)RAST Both rely on homology and already annotated similar genomes.
The cycle of identifying essential genes (aatRNAsynthases, DNA and RNA polymerases, ATPsynthases), and using these to train gene prediction software seems to work well.
Slide11Slide12Slide13Slide14Isoelectric point
(
pI
) of a protein: The pH at which the net charge of the protein is zero.
This can be experimentally determined using
isoelectric focusing gels
.
Theoretical
pI
is calculated from the
pKs
of the individual amino acids.
Slide15PEPSTATS of QAY18538.1 from 1 to 580
Molecular weight = 64213.14 Residues = 580
Average Residue Weight = 110.712 Charge = -74.0
Isoelectric Point = 3.9355
A280 Molar Extinction Coefficients = 21890 (reduced) 22140 (cystine bridges)
A280 Extinction Coefficients 1mg/ml = 0.341 (reduced) 0.345 (cystine bridges)
Probability of expression in inclusion bodies = 0.979
Residue Number Mole%
DayhoffStat
A = Ala 46 7.931 0.922
B = Asx 0 0.000 0.000 C = Cys
4 0.690 0.238 D = Asp 81 13.966 2.539 /.../
Property Residues Number Mole%Tiny (A+C+G+S+T) 157 27.069Small (A+B+C+D+G+N+P+S+T+V) 328 56.552
Aliphatic (A+I+L+V) 169 29.138Aromatic (F+H+W+Y) 38 6.552Non-polar (A+C+F+G+I+L+M+P+V+W+Y) 267 46.034Polar (D+E+H+K+N+Q+R+S+T+Z) 313 53.966Charged (B+D+E+H+K+R+Z) 196 33.793
Basic (H+K+R) 63 10.862Acidic (B+D+E+Z) 133 22.931
Slide16run_pepstats.pl
Slide17parse_pepstats.pl
Slide18parse_pepstats_mod.pl
Slide19parse_pepstats.pl
Slide20parse_pepstats_mod.pl
Slide21parse_pepstats_mod.pl
Slide22histogramScript_pdf.R
Slide23histogramScript_pdf.R
Slide24histogramScript_pdf.R
Slide25pH at which protein has no charge
Slide26pH at which protein has no charge
DNA, cell wall & membrane
bound proteins
Slide27Slide28pH at which protein has no charge
DNA, cell wall & membrane bound proteins
Slide29Histogram of theoretical isoelectric points of
Thermplasmatales
proteins
pH at which protein has no charge
Slide30pH at which protein has no charge
Slide31Histogram of theoretical isoelectric points of
Saccharomyces
proteins
pH at which protein has no charge
DNA, cell wall & membrane bound proteins
Slide32Strategies for extreme halophily
Exclude salts, balance with other osmotically active substances.
Balance external Na
+
Cl
-
with internal K
+ Cl
- This leads to very high internal K+ concentration (> 5M) At this ionic strength, the reach of a charge on a protein does not reach very far.
To compensate, proteins in organisms following the salt in strategy have many negative charges. Consequently, most proteins have an acidic isoelectric point.
Slide33Histogram of theoretical isoelectric points of
Haloferax
proteins
pH at which protein has no charge
Salt in strategy
At neutral pH most proteins with negative charge
Slide34Slide35