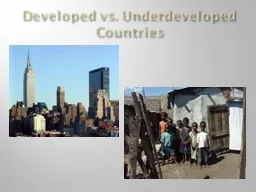
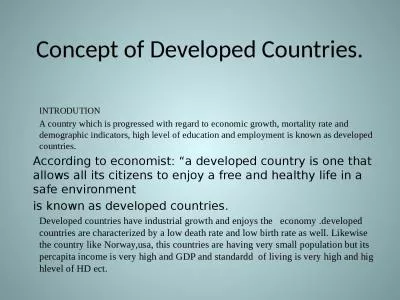
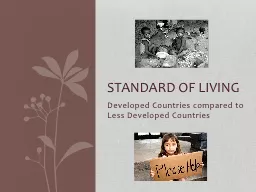
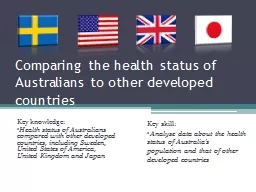
Standard of Living How can we measure standard of living Human Development Index This is the United Nations ranking of countries to better understand economic and social development of the world The HDI is calculated based on ID: 797163
Download The PPT/PDF document "Developed Countries compared to Less Dev..." is the property of its rightful owner. Permission is granted to download and print the materials on this web site for personal, non-commercial use only, and to display it on your personal computer provided you do not modify the materials and that you retain all copyright notices contained in the materials. By downloading content from our website, you accept the terms of this agreement.
Slide1
Developed Countries compared to Less Developed Countries
Standard of Living
Slide2How can we measure standard of living?
Slide3Human Development Index
This is the United Nations ranking of countries to better understand economic and social development of the world. The HDI is calculated based on
Life ExpectancyAdult LiteracyGDP (gross Domestic Product) per capita
Who are the 2012 top 10 countries?
Who are the bottom 10 countries?
Canada ranked #1 from 1994 – 2000. Where does Canada rank now?
http://
hdr.undp.org
/en/content/table-1-human-development-index-and-its-components
Slide4Problems with Human Development index
Some countries may not have accurate records
GDP per Capita not accurate if wealth is in hands of a few billionaires
Government help / agencies can increase standard of living and not be reflected in the numbers
Doesn’t include info in nutrition, healthcare, status of women, quality of life, etc. that lower standard of living
Does not include calculation of poverty line in each country (money goes farther in some places)
What is the poverty line?
World Bank uses $1.25 per day
Canada: spending more than 56% of income on food/ shelter
Slide5Other Ways to Measure Poverty
U5MR: Under Five Mortality Rate
# of children who die before the age of 5Most deaths in LCDs are due to malnutritionU5MR can be 50x
greater in Less developed countries than in developed countries
UNICEF created the Progress of Nations Report on the Welfare of the child in 1998
Measures the risk to children on a scale of 0-100 (1 being low risk, 100 is extremely high risk ) based on:
Infant mortality rate
% of underweight children
% not attending Primary school
Risk from armed conflictRisk of contracting HIV/AIDS
Result:Europe = 6Africa = 61
Slide6Organizations that want to help
United Nations
Government Agencies (CIDA – Canadian International Development Agency)Non-Government Agencies
Free the Children
Red Cross
Amnesty international
Slide7Why are some countries
so wealthy while others are so poor?What defines a Less Developed Country?
History of ColonizationWatch “Africa in the 21st Century”
and “Latin America in the 21 century”
Slide8The gap between the Rich and the Poor widens
Gap between developed Countries and Less developed countries
Gap between regions in CanadaGap between income levels in Canada (and other countries) – richest 10% and poorest 10%The Gap between the rich and the poor is called “Economic Disparity” and that is the point of this chapter
Slide9World Economic Disparity
Slide10World economic disparity over 200 years
Slide11Economic Development
Economy:
Sum of all economic activities that take place in a country (both money economy – ex. Companies, government, and crime – and non-money sector – ex. Education, environment, child-rearing)CHART p. 396Economic Activity:
processes that help produce wealth and maintain quality of life
Slide12Primary, Secondary and Tertiary Industries
Economic Activities divide into Primary, Secondary, and Tertiary Industries
Primary Industry: Extract natural resources (ex Lumber, Oil, crops)Secondary Industry: Manufacturing Industry: manufacturing and construction
Tertiary Industry
: services to businesses and individuals (from McDonalds to hairdresser to banker to Computer programmer
)
Canada has been increasing in Tertiary and decreasing in Primary industry over the last century
1999: Primary
5.8%
Secondary: 19.5% Tertiary: 74.5%
Slide13Slide14To think about . . .
What are the differences between less developed and developed countries?
What is in between?How does a country increase its standard of living?
Slide15LDC vs. Developed countries
Traditional Economy: LDC (Less Developed Countries)
LDCs have significantly more primary industry that Developed countries
LDCs live off
sustenance agriculture
( consume what produce), resulting in
low productivity
(and Low standard of living)
Description: Live off the Land, poor
formal education
(learn traditional skills from parents), technology relies on animals and human labour, many poor people
United Nations tried to increase standard of living in LDCs through new technologies/ machines, and cash crops, but these methods have failed
Slide16LDC vs. Developed countries
Newly Industrialized Countries /Developing Economy:
Technological development – animal and human power replaced by machines (industrial revolution)Need infrastructure in communications and transportation
to complement industry
Description: people demand change and
gov.
puts in effort for change,
public education system
(basic educ. Seen as crucial), mechanization and industrialization (secondary overtaking primary industry), innovative people lead change
Slide17LDC vs. Developed countries
3. Developed Economy (DC)
diverse economy: some primary and secondary, mostly tertiary industriesConsumers expect a variety of goods and services and maintain a mass consumption of products and services\
Description: stable
democratic government,
high and current technology, highly skilled workforce, high standard of living
(ex. Canada)
Slide18LDC vs. Developed countries
How does a country historically increase wealth and encourage development?
Natural resourcesStable GovernmentLiterate/ Educated populationOpen attitude to change and progress
Slide19LDC vs. Developed countries
What are characteristics of countries with low economic development today?
Was a colony in the 20th century (stifled development)(what does that mean? A colony?)High government debt
(HIPC)
Ongoing domestic/ international conflict
Political and economic corruption
Slide20Economic hitmen
Slide21Uneven Consumption
Slide22Poverty Cycle / Trap
What is the poverty Cycle?
What are possible solutions to the poverty trap? Where and how should we intervene?
Slide23Debt
Highly indebted Poor Countries (HIPC)
Where did the Debt come from?International Monetary Fund (IMF) and World Bank created as branch of UN after WW2 to assist / loan money to developing nations to improve living standardsTied aid – money given with conditions (must allow use of land, or resource, or restrict exports, etc.)
****
C
anada, and others, have now forgiven the loans to HIPC ***
Slide24What happened to the Money? Why did it fail?
Money used for
Mega projects (dams, irrigation) that caused more environmental damage than economic good2. Corrupt governments = not all money goes to places of need
3. Loans
needed to be paid
back
Developed
Nations insist on
Cash crops
to export to pay debt = less food Pay all / most profit to debt repayment, not improving economy4. Resources controlled by Foreign Multinational Corporations = money not going to farmers or to less developed country
5. Natural disasters and civil war = increase poverty
Slide25Extra Vulnerable in Poverty:Lower status of Women
Male dominated societies
Treated as property (no legal rights, can be beaten or even killed)Women suffer from Malnutrition (eat after men)Work long hard hours to feed family – no time to improve life (see fig. 14-15 p. 351)Lower education / literacyMarry very young
Many children / births
How to help?
Studies show educated women marry later and have less children, improving the quality of life for the entire family (children survive, better chance at being properly nourished, help break poverty trap)
Slide26Extra Vulnerable in Poverty:Children
Easy victims (disease, famine, war, death)At risk for exploitation (
child labour, sex trade, child soldiers)1999 – 540 million children lived near land mines, ethnic cleansing, civil war1996 – 250 million children between ages 5-14 were working
Slide27Disease – HIV/AIDS
2000 - 35 million people had AIDS
- 8 million orphans due to AIDS - 16,000 more are infected each dayOf 14 million who have died due to AIDS by the year 2000, 11 million are from Africa, and ¼ were childrenLess developed countries have no resources
to deal with the epidemic
Ex. Zimbabwe had 26% of population infected = ½ their health care budget
Slide28Water
1999 – 1.2 billion people lacked safe, clean drinking water (contaminated with human and industrial waste)
Water prioritized for agriculture and “cash crops” for exportContaminated water = disease and death80% of world’s diseases caused by bad water, ex. Parasites, cholera, malaria, typhoid, leprosy, bilharzia all breed in water
https://
www.youtube.com
/
watch?v
=c9WEl6pQIPw
Slide29Suggest some possible solutions to World Poverty
Slide30Poverty Solutions
– Decrease
Population Growth
Decrease Population Growth
Decrease Infant Mortality Rate
Improved sanitation and health care
Improved access to nutrition and clean water
Education for women
Creating options for women
Increase in
Womens
Rights
Improve standard of living
Washing Machines
!
Social Programs
Family Planning
Slide31Poverty Solutions – Debt Forgiveness
Decrease debt burden on developing countries
Much of the debt old and based on IMF recommendations
With more money available governments can focus on social programs and educatio
The World Bank and the IMF (International Monetary Fund) can support developing countries with their debt
However will only restructure debt if they have direct input into Governments’ budgets
Slide32Poverty Solutions – Direct Support
Aid organizations like UNICEF (International Govt)
NGO’s
Nongovernmental Organizations
Red Cross, Drs Without Borders,
Focus on sustainable aid
Building wells with local workers
CIDA
(Canadian International Development Agency)
Tied Aid from Canada
Money needs to be spent in Canada
Microloans
Personal Loans made to small business people directly
Slide33Poverty Solution? - Globalization
Globalization – The opening of world trade
Markets for Developing World’s resources and products
Employment in developing nations
Availability of cheap labour
Unsafe labour practices
With the use of ‘Fair Trade’ Practices and the ILO (International Labour Org.) Globalization could be very positive for the developing world