

Dehaish Outlines Normal distribution Standard normal distribution Find probability when known z score Find z score from known areas Conversion to Standard normal distribution Sampling distribution of sample mean ID: 1026367
Download Presentation The PPT/PDF document "Normal distribution Faisal Bin" is the property of its rightful owner. Permission is granted to download and print the materials on this web site for personal, non-commercial use only, and to display it on your personal computer provided you do not modify the materials and that you retain all copyright notices contained in the materials. By downloading content from our website, you accept the terms of this agreement.


1. Normal distributionFaisal Bin Dehaish
2. OutlinesNormal distributionStandard normal distribution Find probability when known z score Find z score from known areas Conversion to Standard normal distribution.Sampling distribution of sample mean
3. Normal distributionThe normal distribution is the most important probability distribution in statistics because it fits many natural phenomena. For example, heights, blood pressure, measurement error, and IQ scores follow the normal distribution. It is also known as the Gaussian distribution .The normal distribution is a probability function that describes how the values of a variable are distributed.
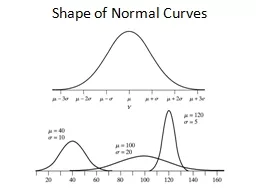
4. Normal distribution Normal distribution has the following properties:Bell shaped curveSymmetrical50%50% μ
5. 68-95-99.7 Rule forNormal Distributions (Empirical rule )68% of the area under the curve within ±1σ of μ95% of the area under the curve within ±2σ of μ99.7% of the area under the curve within ±3σ of μ7: Normal Probability Distributions5
6. Example: 68-95-99.7 Rule Wechsler adult intelligence scores: Normally distributed with μ = 100 and σ = 15; X ~ N(100, 15) 68% of scores within μ ± σ = 100 ± 15 = 85 to 11595% of scores within μ ± 2σ = 100 ± (2)(15) = 70 to 13099.7% of scores in μ ± 3σ = 100 ± (3)(15) = 55 to 1456
7. Standard Normal DistributionThe standard normal distribution has the following properties:mean equal to 0.standard deviation equal to 1. The total area under its density curve is equal to 1.
8. Standard Normal DistributionIn this section we will develop a skill to :Find Areas ( or probabilities ) corresponding to various regions under the graph .Find z scores that correspond to areas under the graph.
9. Probabilities of the Standard Normal Distributionwe have been using "X" to denote the variable of interest (e.g., X=BMI, X=height, X=weight). However, when using a standard normal distribution, we will use "Z" to refer to a variable in the context.Z score: the distance along the horizontal scale of the standard normal distribution ( corresponding to the number of standard deviations above or below the mean ) Z indicates how many standard deviations away from the mean the point x lies.Area: the region under the curve.
10. Normal DistributionP ( x > a ) P ( x < a ) P ( a < x < b ) Standard Normal DistributionP ( z > a ) P ( z < a ) P ( a < z < b )
11. Finding probabilities when given Z ScoreYou can manually find areas by Z score table or technology.
12. Find values on the right of the mean in this z-table. Table entries for z represent the area under the bell curve to the left of z. Positive scores in the Z-table correspond to the values which are greater than the mean.
13. Find values on the left of the mean in this negative Z score table. Table entries for z represent the area under the bell curve to the left of z. Negative scores in the z-table correspond to the values which are less than the mean
14. NOTEThis table designed only for Standard normal distribution. Which is a normal distribution with a mean of 0 and a standard deviation of 1 .The table is in two pages, POSITIVE scores and NEGATIVE scores. Each value in the body of the table is a CUMULATIVE are from the left up to a vertical boundary above a specific z score.
15. Example 1A result of a bone density test score is normally distributed with a mean of 0 and a standard deviation of 1 . A randomly selected adult undergoes a bone density test. Find the probability that this person has a bone density test score Less than 1.27 . 0.8980Answer: the probability that this person has a bone density test score Less than 1.27 is 0.8980
16. Example 2 Using the same bone density test from the previous example, find the probability that a randomly selected person has a result above -1.00 . 0.8413Answer: The probability that a randomly selected person has a result above -1.00 is 0.8413
17. Example 3 A bone density test reading between -1.00 and -2.50 indicates that the subject has Osteopenia. Which is a bone loss. Find the probability that a randomly selected subject has a reading between -1.00 and -2.50 . aArea = ?
18. Answer Step 1 : Find the area of z = -1.00Step 2 : Find the are of z = -2.50Step 3 : 0.1587 – 0.0062 = 0.1525 The probability that a randomly selected subject has a bone density reading between -1.0 and -2.50 is 0.1525
19. Finding Z score from known areasIn many cases , we need a method for reversing the format given a known area or probability, find the corresponding z score. In such cases it is really important to avoid confusion between z score and areas . Remember that z score are distance along the horizontal scale , but areas or probabilities are regions under density curve.
20.
21. ExampleSearch in the body table for an area of 0.025 . The result is z = -1.96.Search in the body table for an area of 0.975 . The result is z = 1.96
22. Special CasesUsually select the larger value when the area falls in between two table values. Special Cases should be considered. 0.9500 falls between 1.64 and 1.65 . An area of 0.9999 is not in the table
23. To work with any NON-STANDARD NORMAL DISTRIBUTION with a mean different from 0 and or a standard deviation different from 1 . The key is a simple conversion formula, which allows us to STANDARDIZE any normal distribution. So that x values can be transformed to z score. Then the methods of the preceding section can be used.
24. Normal DistributionP ( x > a ) P ( x < a ) P ( a < x < b ) Standard Normal DistributionP ( z > a ) P ( z < a ) P ( a < z < b )
25. Example We noted that a pulse rates of adult males are normally distributed with a mean of 69.6 bpm and a standard deviation of 11.3 bpm. Find the proportion of adult males with a pulse rate greater than 100 bpm . Answer: Step one, convert a pulse rate of 100 bpm to its z score
26. Step two , find the cumulative area to the left of z = 2.69 . The cumulative area is 0.9964 . Step three, because the total area under the curve is 1, 1 – 0.9964 = 0.0036
27. Sampling distributionA sampling distribution is a probability distribution of a statistic obtained through a large number of samples drawn from a specific population. The sampling distribution of a given population is the distribution of frequencies of a range of different outcomes that could possibly occur for a statistic of a population.Each sample has its own sample mean and the distribution of the sample means is known as the sample distribution.Not just the mean can be calculated from a sample. Other statistics, such as the standard deviation, variance, proportion
28. Types of sampling distribution:Sampling distribution of the mean.Sampling distribution of the proportion.Sampling distribution of the variance.
29. Sampling distribution of the sampling meanExample:
30. Sampling Distribution of the sample mean
31. The value of the mean of the population ( 4, 5, 9 ) is 6 . Using the previous tables, we could calculate the mean of the sample values and we get 6 . Because the means of the sample means is equal to the mean of the population, We can conclude that the values of the sample mean do target the value of the population mean.