
Water entering the soil at the ground surface It replenishes the soil moisture deficiency and the excess moves downward by force of gravity called deep seepage or percolation and builds up the ground water table ID: 1025828
Download Presentation The PPT/PDF document "Infiltration Infiltration" is the property of its rightful owner. Permission is granted to download and print the materials on this web site for personal, non-commercial use only, and to display it on your personal computer provided you do not modify the materials and that you retain all copyright notices contained in the materials. By downloading content from our website, you accept the terms of this agreement.


1. Infiltration
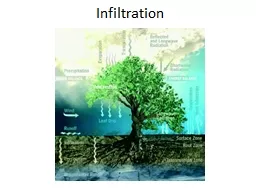
2. InfiltrationWater entering the soil at the ground surface It replenishes the soil moisture deficiency and the excess moves downward by force of gravity called deep seepage or percolation and builds up the ground water table
3. InfiltrationInfiltration CapacityThe maximum rate at which the soil in an given condition is capable of absorbing water
4. InfiltrationInfiltration often begins at a high rate (20 to 25 cm/hr) and decreases to a fairly steady state rate as rain continues, called the ultimate (= 1.25 to 2.0 cm/hr).
5. Infiltration
6. InfiltrationThe infiltration rate f at any time t is give by Horton’s equationInitial rate of infiltration capacityFinal constant rate of infiltration at saturationConstantTime
7. InfiltrationShaded area in Figure
8. InfiltrationThe infiltration depends upon The intensity and duration of rainfallWeather (Temperature)Soil characteristics Vegetal coverLand useInitial soil content (initial wetness)Trapped air and depth of the ground water table
9. InfiltrationMethods of determining infiltrationInfiltrometers Observation in pits and pondsPlacing a catch basin below a laboratory sampleArtificial rain simulatorsHydrograph analysis
10. InfiltrationDouble ring infiltrometer
11. InfiltrationA double ring infiltrometer consists of two ringsThe two rings (22.5 to 90 cm diameter) are driven into the ground by a driving plate and hammer, to depth of 15 cm. After driving is over, any disturbed soil adjacent to the sides tamped with a metal temper. Point gauges are fixed in the center of the rings and in the annular space between the two rings.
12. InfiltrationWater is poured into the rings to maintain the desired depth (2.5 to 15 cm with a minimum of 5 mm) and the water added to maintain the original constant depth at regular time intervals (after the commencement of the experiment) of 5, 10, 15, 20, 30, 40, 60 min, etc. Up to a period of at least 6 hours is noted and the results are plotted as infiltration rate in cm/hr vs. time in minutes.
13. Infiltration
14. InfiltrationExample: In a double ring infiltrometer test, a constant depth of 100 mm was restored at every time interval the level dropped as given below:Time (min)0510152545607590100130Depth of water (mm)10083879085788585858080Establish the infiltration equation of the form developed by Horton
15. Infiltration
16. Infiltration(i) Plot on semi-log paper ‘ t vs. log (f-fc)
17. Infiltration
18. Example : For a small catchment, the infiltration rate at the beginning of rain was observed to be 90 mm/hr and decreased exponentially to a constant rate of 8 mm/hr after 2.30 hr. The total infiltration during 2.30 hr was 50 mm. Develop the Horton’s equation for the infiltration rate at any time t< 2.30 hr
19. Horton equation is :
20. InfiltrationInfiltration indexIt is the most commonly used method for determination of loss of rainwater due to abstraction. The method assumes a constant value for the intake rate of rainwater into the soil for the full duration of the storm. There are three types of infiltration indices: (i) φ-index (ii) W-index (iii) fave-index
21. InfiltrationThe infiltration index is also called the index. The index gives the index of the average abstraction of rainwater.The φ-index is defined as that rate of rainfall above which the rainfall volume equals the runoff volume. The φ-index is relatively simple and all losses due to infiltration, interception and depression storage (i.e., storage in pits and ponds) The remaining volume of rainfall, which flows out as surface runoff is called the excess rainfall volume.
22.
23. InfiltrationProcedure for determination of the indexDraw the hyetograph of the storm rainfall and compute the total volume of rainfall. Compute the excess runoff volume from the storm hydrograph by separating the base flow from it. Subtract (2) from (1) to determine the total intake of rainwater into the soil.
24. InfiltrationProcedure for determination of the indexDivide the value at (3) with the effective rainfall period to get the index (cm/hr) Index (cm/hr)=(total intake of water into the soil/ effective rainfall period)
25. InfiltrationExample :A storm with 20 cm of precipitation produced a surface runoff of 11.6 cm. estimate the index of the storm if the data recorded is as follows: Time (h)12345678Incremental rainfall per hour (cm)0.81.83.04.63.63.22.01.0
26. InfiltrationSolution :Infiltration of the rainwater into the soil = 20 – 11.6 = 8.4 cmThe solution has to be found by selecting the effective rainfall period iteratively. Assume that the full length of the storm period, i.e. 8 hours is the effective rainfall period.
27. InfiltrationSolution :Therefore Index = 8.4/8 = 1.05 cm/hHowever, this value of Index is more than the rainfall recorded during the first and the eighth hour respectively, which is not possible.
28. InfiltrationTherefore, by assuming again that the effective rainfall period is 6 hours, we eliminate the chance for occurrence of any excess rainfall during the first and eighth hour respectively. Then for the 6-hour effective time period, the infiltration loss is= 20 – 0.8 – 1.0 – 11.6 = 6.6 cmTherefore, index = 6.6/6 = 1.1 cm/h
29. InfiltrationThis value of is not more than any of the values of precipitation from the second to the seventh hour of the storm, and is, therefore, acceptable. Rainfall intensity (cm/h)