
2x 2 4x3x 5 3xx 2 x 2x 5 4x 32x 7 3x2x 7 6x4x 5 x1 x 1 2x 2 5x 3 2 7x 5x 2 4x 4x 5 2x ID: 904803
Download The PPT/PDF document "Math 2 Warm Up Simplify each expression:" is the property of its rightful owner. Permission is granted to download and print the materials on this web site for personal, non-commercial use only, and to display it on your personal computer provided you do not modify the materials and that you retain all copyright notices contained in the materials. By downloading content from our website, you accept the terms of this agreement.


Slide1
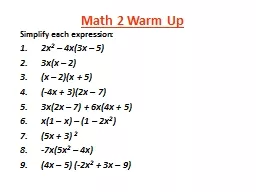
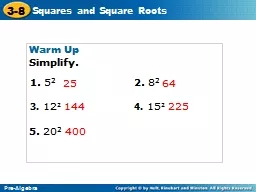
Math 2 Warm Up
Simplify each expression:
2x
2
– 4x(3x – 5)
3x(x – 2)
(x – 2)(x + 5)
(-4x + 3)(2x – 7)
3x(2x – 7) + 6x(4x + 5)
x(1 – x) – (1 –
2x
2
)
(5x + 3)
2
-7x(
5x
2
–
4x)
(
4x
–
5) (-2x
2
+
3x – 9)
Slide2Unit 5: “Quadratic Functions”
Lesson 1 - Properties of Quadratics
Objective
: To find the vertex & axis of symmetry of a quadratic function then graph the function.
quadratic function
–
is a function that can be written in
the standard form:
y = ax
2
+
bx
+
c
,
where
a
≠ 0
.
Examples
:
y
=
5x
2
y =
-2x
2
+
3x y
=
x
2
– x – 3
Slide3Properties of Quadratics
parabola
– the graph of a quadratic equation. It is
in the form of a “
U
” which opens either upward or downward.vertex – the maximum or minimum point of a parabola.
Slide4Properties of Quadratics
axis
of symmetry
–
the
line passing through the vertex about which the parabola is symmetric (the same on both sides).
Slide5Properties of Quadratics
Find the coordinates of the vertex, the equation for the axis of symmetry of each parabola. Find the coordinates points corresponding to
P
and
Q
.
Slide6Graphing a Quadratic Equation
y = ax
2
+
bx + c1) Direction of the parabola
?
If
a
is
positive
,
then the
graph opens
up
. If a is negative, then the graph opens down.
Slide7Graphing a Quadratic Equation
y = ax
2
+
bx + c2)
Find the vertex and axis of symmetry
.
The
x-coordinate
of the vertex
is
(also the equation for the
axis of symmetry
).
Substitute
the value of
x into the quadratic equation and solve for the y-coordinate. Write vertex as an
ordered pair (
x , y).
Slide8Graphing a Quadratic Equation
y = ax
2
+
bx + c3) Table of Values
.
Choose
two
values
for
x
that are
one side of the vertex (either right
or
left)
. Substitute
those values into the quadratic equation to find y values. Graph the two points.Graph the reflection of the two points on the other side of the parabola (same y-values and same distance away from the axis of symmetry).
Slide9Find
the vertex
and axis of symmetry of
the following quadratic
equation. Then, make
a table of values and graph the parabola.
y = 2x
2
+ 4x +
3
Direction:
_____
Vertex: ______
Axis: _______
Slide10Find
the vertex
and axis of symmetry of
the following quadratic
equation. Then, make
a table of values and graph the parabola.
y =
– x
2
+ 3
x – 1
Direction: _____
Vertex: ______
Axis: _______
Slide11Find
the vertex
and axis of symmetry of
the following quadratic
equation. Then, make
a table of values and graph the parabola.
y = –
x
2
+
2x + 5
Direction: _____
Vertex: ______
Axis: _______
Slide12Find
the vertex
and axis of symmetry of
the following quadratic
equation. Then, make
a table of values and graph the parabola.
y = 3x
2
–
4
Direction: _____
Vertex: ______
Axis: _______
Slide13Apply!
The number of widgets the
Woodget
Company sells can be modeled by the equation
-5p
2 + 10p + 100, where p is the selling price of a widget. What price for a widget will maximize the company’s revenue? What is the maximum revenue?
Slide14Slide15End of Day 1
Slide16Math 2
Unit 5
Lesson 2
Unit 5
:"Quadratic Functions"
Title: Translating Quadratic FunctionsObjective: To use the vertex form of a quadratic function.
y = a(x – h)
2
+ k
w
here (h, k) is the vertex
.
Slide17Example 1
: Graphing from Vertex Form
Direction: _____
Vertex: ______
Axis: _______
y = 2(x – 1)
2
+ 2
Slide18Example 2
: Graphing from Vertex Form
Direction: _____
Vertex: ______
Axis: _______
y =
(
x
+ 3)
2
– 1
Slide19Example 3
: Graphing from Vertex Form
Direction: _____
Vertex: ______
Axis: _______
y =
(x
–
3)
2
– 2
Slide20Example 4
: Write quadratic equation in vertex form.
Slide21Example 5
: Write quadratic equation in vertex form.
Slide22Example 6
: Converting Standard Form to Vertex Form.
Step 1: Find the Vertex
x
=
-b =
y
=
St
ep 2: Substitute into Vertex Form:
2a
y = x
2
- 4x + 6
Slide23Example 7
: Converting Standard Form to Vertex Form.
Step 1: Find the Vertex
x
= -b =
y
=
St
ep 2: Substitute into Vertex Form
:
2a
y = 6x
2
– 10
Slide24Example 8
: Converting Vertex Form to Standard Form.
Step 1: Square the Binomial.
Step 2: Simplify to
y = 2(x – 1)
2
+ 2
Slide25Example 9
: Converting Vertex Form to Standard Form.
Step 1: Square the Binomial.
Step 2: Simplify to
y =
(x
–
3)
2
– 2
Slide26Honors Math 2 Assignment:
I
n the Algebra 2 textbook:
pp. 251-253 #3, 6, 9, 17-20, 25, 27, 31, 34, 52, 54
Slide27End of Day 2
Slide28Slide29Factoring Quadratic Expressions
Objective
: To find common factors and binomial factors
of quadratic expressions.
factor – if two or more polynomials are multiplied together,
then each polynomial is a
factor
of the product.
(2x + 7)(3x – 5)
=
6x
2
+ 11x – 35
FACTORS
PRODUCT(2x – 5)(3x + 7)
= 6x2 – x – 35
FACTORS
PRODUCT
“
factoring a polynomial
”
– reverses the multiplication!
Slide30Finding Greatest Common Factor
greatest common factor
(GCF) –
the greatest of the common factors of two or more monomials.
+ 20
x
12
24
x
Slide31Slide32Finding Binomial Factors
+ 14
x
40
Slide33Finding Binomial Factors
+ 12
x
32
Slide34Finding Binomial Factors
11
x
24
Slide35Finding Binomial Factors
17
x
72
Slide36Finding Binomial Factors
14
x
32
Slide37Finding Binomial Factors
3
x
28
Slide38Finding Binomial Factors
11
x
12
Slide39Finding Binomial Factors
31
x
35
Slide40Finding Binomial Factors
32
x
35
Slide41Finding Binomial Factors
16
x
12
Slide42Finding Binomial Factors
*
35
x
45
Slide43Finding Binomial Factors*
42
x
Slide44Finding Binomial Factors*
9
0
x
Slide45Factoring Special Expressions*
49
9
192
36
Slide46Honors Math 2 Assignment
In
the
Algebra 2 textbook,pp. 259-260
#1, 5, 6, 7-45 odd, 48, 54
Slide47End of Day 3
Slide4835
x
45
36
16
x
12
Factor.
Slide49Solving Quadratics Equations:
Factoring and Square Roots
Objective
: To solve quadratic equations by factoring and by finding the square root.
Slide50Solve by Factoring
7
x
18 = 0
Slide51Solve by Factoring
20
x
7 = 0
Slide52Solve by Factoring
5 = 6
x
Slide53Solve by Factoring
Slide54Solve by Factoring*
16
x
= 10
x
Slide55Solve by Factoring
*
Slide56Solve Using
Square
Roots
Quadratic equations in the form
can be solved by finding square roots.
= 243
Slide57Solve Using
Square
Roots
200 = 0
Slide58Solve Using
Square
Roots*
25 = 0
Slide59Honors Math 2 Assignment
In
the
Algebra 2 textbook,p. 266
#1-19
Slide60End of Day 4
Slide61Complex Numbers
Slide62Math 2 Warm Up
In
the
Algebra 2 Practice Workbook
,Practice 5-5 (p. 64)
#1, 10, 13, 19, 25, 31,
40, 46, 55, 61, 71, 73
Slide63Slide64Unit 4, Lesson 5:
Complex Numbers
Objective: To define imaginary and complex numbers and to perform operations on complex numbers
Slide65Introducing Imaginary Numbers
Find the solutions to the following equation:
Slide66Introducing Imaginary Numbers
Now find the solutions to this equation:
Slide67Imaginary numbers offer solutions to this problem!
i
1
=
i
i
2
= -1
i
3
= -
i
i
4
= 1
Slide68Simplifying Complex Numbers
i
21
Slide69Adding/Subtracting Complex Numbers
(8 + 3i) – (2 + 4i)
7 – (3 + 2i)
(4 - 6i) + (4 + 3i)
Slide70Multiplying Complex Numbers
(12i)(7i)
(6 - 5i)(4 - 3i)
(4 - 9i)(4 + 3i)
(3 - 7i)(2 - 4i)
Slide71So, now we can finally find ALL solutions to this equation!
Slide72Complex Solutions
3x² + 48 = 0
-5x² - 150 = 0
8x² + 2 = 0
9x² + 54 = 0
Slide73Math 2 Assignment
In
the
Algebra 2 Textbook
,Pgs. 274-275
#s 1-17 odd, 29-39 odd, 41-46
Slide74End of Day 5
Slide75Slide76Completing the Square
1.) Move the constant to opposite side of the equation as the terms with variables in them.
2.) Take half of the coefficient with the x-term and square it
3.) Add the number found in step 2 to both sides of the equation.
4.) Factor side with variables into a perfect square.
5.) Square root both sides (put + in front of square root on side with only constant)6.) Solve for x.
Slide77Solve the following,
using completing the square
1.) x2 – 3x – 28 = 0 2.)
x
2
– 3x = 4 3.) x2 + 6x + 9 = 0
Slide78If a ≠ 1, then divide all the term by “a”.
1.) 2x
2
+ 6x = -6 2.)
3x
2 – 12x + 7 = 0 3.) 5x2 + 20x + -50
Slide79Math 2 Assignment
In
the
Algebra 2 Textbook
,Pgs
281-283
#
15 – 25,
37
, 39
,
51-53
Slide80End of Day 6
Slide81Solve using Completing the square
x
2 + 4x = 21
x
2
– 8x – 33 = 04x2 + 4x = 3
Slide82Solving
Quadratic Equations:
Quadratic Formula
Objective
: To solve quadratic equations using the Quadratic Formula.Not every quadratic
equation
can be
solved
by
factoring or by
taking
the
square
root
!
5
x
= 0
Slide83Solve using Quadratic Formula
5
x
8 = 0
Slide84Solve using Quadratic Formula
23
x
40 = 0
Slide85Solve using Quadratic Formula
Slide86Solve using Quadratic Formula*
Slide87Solve using Quadratic Formula
Slide88Solve using Quadratic Formula
Slide89Solve using Quadratic Formula
= -6
x
– 7
Slide90Honors Math 2 Assignment
In
the
Algebra 2 textbook,
pp
.
289-290
#1, 2, 22-30
Slide91Solve
= 41
= -6
x
– 7
{-8.71, 4.71}
No Solution
Slide92End of Day 7
Slide93Solving Quadratic Equations:
Graphing
Objective
: To solve quadratic equations and systems that contain a quadratic equation by graphing.
When the graph of a function
intersects the x-axis, the
y-value of the function
is
0
.
Therefore, the
solutions of
the quadratic equation
ax
2
+
bx + c = 0 are the
x-intercepts of the graph.Also known as the “zeros
of
the
function” or the “
roots
of the function
”
.
Slide94Solve Quadratic Equations by Graphing
Solution
Solution
Slide95Solve Quadratic Equations
by Graphing
Step 1
: Quadratic equation must equal 0!
ax
2 + bx
+
c
=
0
Step 2
: Press [Y=]. Enter
the
quadratic equation
in
Y1. Enter
0 in Y2. Press [Graph].
MAKE SURE BOTH X-INTERCEPTS ARE ON SCREEN! ZOOM IF NEEDED!Step 3: Find the intersection of
ax
2
+ bx +
c
and
0
.
Press
[
2
nd
]
[Trace]
.
Select
[5
:
Intersection]
.
Press
[
Enter]
2 times for 1
st
and 2
nd
curve.
Move cursor to
one
of the
x-intercepts
then press
[Enter]
for the 3rd time. Repeat Step 3 for the second x-intercept
!
Slide96Solve by Graphing
6
x
4 = 0
Slide97Solve by Graphing
4
x
– 7 = 0
Slide98Solve by Graphing
5
x
= 20
Slide99Solve by Graphing
=
19
x
Slide100Solve by Graphing
= -2
x
+ 7
Slide101Solve by Graphing
2
x
– 6 = 0
Slide102Solve by Graphing
+ 16
= 0
Slide103End of Day 8
Slide104Solving Systems of Equations
Slide105Solve a System with a Quadratic Equation
x
Slide106Solve a System with a Quadratic Equation
x
Slide107Solve a System with a Quadratic Equation
Slide108Solve a System with a Quadratic Equation
x
Slide109Solve a System with Quadratic Equations
Slide110Solve a System with Quadratic Equations
Slide111Honors Math 2 Assignment
In
the
Algebra 2 textbook,pp.
266-267
#20-31, 35, 54-56
Solve each quadratic equation or system by graphing.
Slide112Modeling Data with Quadratic Equations
Objective
: To model a set of data with a quadratic function.
Graph: Graph:
(-3, 7), (-2, 2), (0, -2
)
(-1, -8), (2, 1), (3, 8)
(3, 7), (1, -1), (2, 2)
Slide113End of Day 9
Slide114Finding a Quadratic Model
1)
Turn on plot
:
Press [
2nd] [Y=], [ENTER], Highlight “On”, Press [ENTER] 2)
Turn on diagnostic
:
Press
[2
nd] [0]
(for catalog
),
S
croll
down to find
DiagonsticOn
. Press [ENTER] to select.Press [ENTER] again to activate.
Slide115Finding a Quadratic Model
3)
Enter data values
:
Press [STAT], [ENTER] (for EDIT),Enter x-values (independent) in L1Enter y-values (dependent) in L2
Clear Lists (if needed)
:
Press [STAT], [ENTER] (for EDIT),
Highlight L1 or L2 (at top)
Press [CLEAR], [ENTER].
Slide116Finding a Quadratic Model
4)
Graph scatter plot
:
Press [ZOOM],
9 (zoomstat)5) Find quadratic equation to fit data:
Press
[
STAT],
over to CALC,
For
Quadratic Model - Press 5:
QuadReg
Press [ENTER] 4 times, then
Calculate
.
Write quadratic equation using the values of a, b, and c rounded to the
nearest thousandths if needed.Write down the
R2 value!
Slide117Find a quadratic equation to model the values in the table.
X
Y
-1
-8
2
1
3
8
Slide118is a
measure of
the
“
goodness-of-fit”
of
a regression model.
the
value
of
R
2
is
between
0
and 1 (0 ≤
R2 ≤ 1)R
2
= 1
means
all
the data points “fit” the model (lie
exactly on
the graph with
no
scatter) –
“knowing x
lets you predict
y
perfectly
!”
R
2
=
0
means
none
of the data points “fit” the model –
“knowing
x
does not
help
predict y!”
An
R
2
value
closer to
1
means the better the regression model “fits” the data.
Slide119Find a quadratic equation to model the values in the table.
X
Y
2
3
3
13
4
29
Slide120Find a quadratic equation to model the values in the table.
X
Y
-5
-18
0
-4
2
-14
Slide121Find a quadratic equation to model the values in the table.
X
Y
-2
27
1
10
5
-10
7
12
Slide122Apply!
The table shows data about the wavelength (in meters) and the wave speed (in meters per second) of the deep water ocean waves. Model the data with a quadratic function then use the model to estimate:
the wave speed of a deep water wave that has a wavelength of 6 meters.
the wavelength of a deep water wave with a speed of 50 meters per second.
Wavelength
(m)
Wave
Speed (m/s)
3
6
5
16
7
31
8
40
Slide123Apply!
The table at the right shows the height of a column of water as it drains from its container. Model
the data with a quadratic function then use the model to
estimate:
the water level at 35 seconds.
the waver level at 80 seconds.
the water level at 3 minutes.
the elapsed time for the water level to reach 20 mm.
Slide124Honors Math 2 Assignment
In
the
Algebra 2 textbook, pp. 237-238
#16-22, 30, 31, 38
Write down the R² value for
each equation
!
Slide125End of Day 10
Slide126Unit 5 Test Review: “Quadratics”
Quadratic Function
Standard form:
Vertex form:
Change Forms!
Direction -
p
arabola opens up or down?
Vertex (
, substitute
x
to find y
) or (
h
,
k
)
Vertex – is a Maximum or Minimum?
Axis of Symmetry
or
x = h
y-intercept (
0
,
c
) or (
0
,
substitute 0 to find y
)
Graph (at least 5 points – vertex and 2 points on each side of axis of symmetry)
Slide127Unit 5 Test Review:
“Quadratics”
Solve Quadratic Equations by:
Factoring – Zero Product Property
Square Root – Don’t forget
±
Quadratic Formula
Use Discriminant for Number & Types of Solutions
Graphing
–
Find Intersection
on
Calculator
Solve System with Quadratic by Graphing
Quadratic Model for a Set of Data
Quadratic Regression Model
:
Find
R²
value and what it means
Predict
Values
(x or y) using Quadratic Model
Slide128Math 2 Assignment
In the
Algebra 2 textbook
,
pp. 293-295 #2-11, 12ce, 13-38, 70-72
Slide129Math
2 homework
In
the
Algebra 2 textbook,p. 296 #
6
, 14, 24, 25, 27
28, 30,
33
, 38, 39