
Nigeria Bank Analysis LAPO Microfinance Bank Limited Nigeria Bank Analysis Dec emb er 20 20 Financial d ata USD m c om parative 311218 311219 NGNUSD avg 3056 3064 NGNUSD close 30 ID: 849283
Download Pdf The PPT/PDF document "Public Credit Rating" is the property of its rightful owner. Permission is granted to download and print the materials on this web site for personal, non-commercial use only, and to display it on your personal computer provided you do not modify the materials and that you retain all copyright notices contained in the materials. By downloading content from our website, you accept the terms of this agreement.


1 Nigeria Bank Analysis | Public Cred
Nigeria Bank Analysis | Public Credit Rating LAPO Microfinance Bank Limited Nigeria Bank Analysis Dec emb er 20 20 Financial d ata: (USD m c om parative ) 31/12/18 31/12/19 NGN/USD (avg.)* 305.6 306.4 NGN/USD (close)* 306.5 306.5 Total assets 223.6 253.5 Total capital 58.5 72.2 Net advances 184.1 199.7 Liquid assets 28.4 39.0 Operating income 86.2 98.0 Profit after tax 9.5 17.7 Market capitalisation Not applicable. Market share** 21.5 % . * C enPrMl BMnk of NigeriM (âFBNâ) rate. ** Based on total subsector loans and advances at 31 December 201 9 . Rating h istory : Initial rating ( July 201 7 ) Long term rating: BBB+ (NG) Short term rating: A2 (NG) Rating o utlook: Stable L ast rating ( Nov ember 201 9 ) Long term rating: BBB+ (NG) Short term rating: A2 (NG) Rating outlook: Stable Related methodologies/research: Global Criteria for Rating Banks and Other updated March 2017 Global Criteria for Rating Microfinance Institutions, Updated March 2017 L APO Mfb rating reports (2017 - 19) Glossary of Terms/Ratios, February 2016 GCR contacts: Primary Analyst Yinka Adeoti Credit Analyst ade oti @ gcrratings.c om Committee Chairperson Dave King Analyst location: Lagos, Nigeria Tel: +23 41 904 - 9462 - 3 Website: www. globalratings.com.ng Summary r ating rationale ï· IAPO MicrofinMnce BMnk IimiPed (âIAPO MfNâ or âPOe NMnkâ) maintained its dominant posit ion within the Nigeria n microfinance banking space , accounting for a sizeable 21.5 % of POe suNsecPorâs PoPMl loans and advances as at 31 December 201 9. The assigned ratings reflect POe NMnkâs sProng cMpiPMlisMPion, MdequMPe funding Mnd liquidiPy posiPion , although constrained b y the sharp deterioration in profitability and asset quality metrics , as well as the current elevated credit risk within the microfinance banking subsector. ï· IAPO MfNâs capitalisation is considered adequate for its current risk level, with a risk w eigOPed cMpiPMl MdequMcy rMPio (âFARâ) of 32B6% registered at FY19 (FY18: 29.3%). While the bank registered a notable year - on - yeMr (â y/y â) 23.5% growth in s OMreOoldersâ funds in FY19 largely driven by internal capital generation , a combinatio n of ne at year - to - date and increased risk weighted assets moderated the CAR to 25% at 3Q FY20, albeit remain ed well above the regulatory minimum of 10%. ï· Liquidity risk appears well managed, with the NMnkâs key liquidity metrics comparing favoura bl y with regulatory requirements. Specifically, POe NMnkâs sPMPuPory liquidiPy rMPio ranged between 26.8% and 37.2% throughout FY19 (ending the year at 37.2%), compared with the 20% statutory benchmark. Furthermore, the contractual matching of assets and l ia bilities maturities showed a cumulative liquidity buffer across the up to one - year maturity band, with liquidity buffer amounting to N48. 8 bn RiPOin POe mosP criPicMl âless POMn POree - monPOâ mMPuriPy NMndB Additionally, stable funding in the form of equit y and member deposits further lessens liquidity risk. ï· IAPO MfNâs MsseP quMliPy (loMn Mnd MdvMnces) is considered highly susceptible to macroeconomic vagaries (particularly the COVID - 19 pandemic and the recent nationwide protest ) , this is evidenced by the de terior a tion in gross non - 3Q FY20 (FY19: 10.3%), far beyond the FBNâs tolerable limit of 5%. The weak net NPL ratio of 11.7% at 3Q FY20 (FY19: 2.1%) portrays inadequate provisionin g, while the risk of capital erosi on appears significant , considering the deteriorated net NPL/ capital ratio of 31.8% at 3Q FY20 (FY19: 5.8%). ï· Having displayed strong financial performance over the review period to FY19, LAPO Mfb registered a net loss of N1.6bn in 3Q FY20. This was attrib uted to the tough operating environment , exacerbated by both the COVID - 19 pandemic and the recent nationwide protest, which adversely impacted on loan repayments and collections. While man agement had indicated some remedial actions to improve loan collecti ons, Global FrediP RMPing compMny IimiPed (âGFRâ) expecPs the weak financial performance to persist over the short term. Factors that could trigger a rating action may include Positive change : This could follow a satisfactory improvement in the NMnkâs a sset quality position and financial performance . Negative change : A sustained pressure o n asset quality and p rofitability metrics could trigger a negative rating action . Rating class Rating scale Rating Rating outlook Expiry date Long - term National BBB (NG) Stable Novem ber 20 2 1 Short - term National A3 (NG) Nigeria Bank Analysis | Public Credit Rating Page 2 Organisational profile Corporate summary LAPO Mfb was initially fo unded as a non - government al orgMnisMPion (âNG O â) in 198 7, registered with the Corporate Affairs Commission in 1993 , and subsequently incorporated as a private limited liability c ompany in April 2007 . The company thereafter obtained CBN âs approval to operat e as a microfinance bank in June 2010 . LAPO Mfb was re - licensed as a National MFB i n September 2012 in line with the new microfinance banking model introduced in the country by C BN in 2011. Ownership structure LAPO Mfb is largely owned by two key investor s: Mr Godwin Ehigiamusoe (the founder and immediate past MMnMging GirecPor (âMGâ)) Mnd Mn insPiPuPionMl investor (Lift Above Poverty Organisation), with ownership stakes of 40% a nd 56.9% respectively as at 30 September 2020. The remainder (3.1%) is owned b y other director
2 s in the company. Strategy and o
s in the company. Strategy and o perations LAPO Mfb has been progressing well with the implementation of its five - year strategic plan (covering the 2018 - 20 22 per iod). This strategic initiative centre s around two cardinal goals : (i) strengt hening of the NMnkâs competitive position and market share by leveraging technology to support digitalisation and operational efficienc y ; and (ii) launching of more customer - centric products and enhanc ing service delivery to improve customers banking exper ience . LAPO Mfb âs microfinMnce NMnking McPiviPies Mre strategically targeted at micro, small and medium enPerprises (âMSME s â), pMrPiculMrly poor women micro enterprises owne rs , who are served on a group basis. Specifically, membership of a LAPO Mfb Union 1 is a mandatory requirement for accessing the NMnkâs finMncingB These financing are offered through POe NMnkâs MrrMy of loMn producPs, ROicO include : R egular L oan s , Festival L oan s , Asset Loan s , Enterprise D eve lopment Loans Scheme, Special L oans , and Nedogh ama L oan s , with e a ch having unique characteristics (in terms of target customer , amount, purpose , tenor and applicable interest rates ) . During 2019, the bank launched a p ay roll lending product , which is primarily targeted at civil servant s across five pilo t states (Lagos, Edo, Oyo, Enugu and Rivers ) and POe FederMl FMpiPMl TerriPory (âFFTâ) . According to management, these states were selected having met the outlined criteria (particularly consistency with salary payment) , and the loan repayment s are usually deducted at source through the g overnmenPâs payroll platform ( Integrated Payroll and Personnel Information System ) . The roll out of this product necessitated the re cruitm ent of additional staff , thus increasing staff complement by 674 to 7,474 at FY19. 1 A self - selected group of people who access LAPO Mfb âs loans individually, but have group guarantees. A s at 30 September 2020, LAPO had 535 branch networks (FY19: 495), spread across 34 states of the cou ntry and FCT . These branches are categorised into three (Super, Mega and Regular) based on their permitted activity level. For administrative convenience, t he branches are clustered into area offices, while the area offices are further desegregated into zo nal offices. S upervisory functions are tiered in that order, with the zonal offices reporting to the head office. Presently, LAPO Mfb âs operMPions are suppo rted by Orbit - R microfinance banking software package , developed by Neptune Software Plc . However, t he bank is in the process of replacing th e IT platform with Oracle Flex cube b y the end of 2020 . According to management , the new IT platform is considered h ighly scalable and expected to support its digitalisation initiatives , as well as en hance customers banking experience. Governance structure L APO Mfb âs corporMPe governMnce sPrucPure is in line RiPO FBNâs Code of Governance for Microfinance Banks in Niger iM (âFGMBNâ) , and Securities and ExcOMnge Fommissionâs guidelines f or best practices . As at 30 September 2020, POe NoMrd of direcPors (âPOe NoMrdâ) comprised ten members, made up of five executive directors (including the MD ) and five non - executive directo rs (includ ing the Chairman and two independent directors). A m ajor change on the board in 2020 was the retirement of the erstwhile MD , Mr Godwin Ehigiamusoe and subsequent elevation of Mrs Cynthia Ikponmwosa as his successor . Further changes to the board i n the same year include the retirement of an executive direct or and a non - executive director , whom have since been replaced . Overall, the board has a good mix of knowledge and experience across banking and other business fields based on the memNersâ profil e. The board performs its oversight functions through five standing committees, viz . Audit Committee, Risk Management Committee, Finance and General Purpose Committee, Nomination and Remuneration Committee, and Environment, Social & Governance Committee. While these committees have the authority to examine particu lar issues and report back to the board with their decisions or recommendations, the ultimate responsibilities on all matters rest with the board. Financial reporting LAPO Mfb prepares its finan cial statements in accordance with International Financial Re porting Standards, the Companies and Allied Matters Act, Financial Reporting Council of Nigeria requirements and the Banks and Other Financial Institutions Act. The external auditor, Deloitte & T ouche , issued an unqualified opinion on the 2019 financial st atements. Nigeria Bank Analysis | Public Credit Rating Page 3 Operating environment Economic overview The Nigerian economy slipped into recession in 3Q 2020, following the second consecutive quarter contraction in gross domestic products ( "GDP"), whic h contracted by 3.62% year - on - year. The negative trend was primarily attributed to the sharp slowdown in economic activities occasioned by the COVID - 19 pandemic, and compounded by weak global crude oil demand and the relatively low prices on th e internatio nal market. In a bid to stimulate prices, the Organisation of Petroleum Exporting Countries (OPEC) and its allies agreed to a global production cut of about 10 million barrels per day in mid - April 2020. This production cut, coupled with the gra dual easing of lockdowns across most countries, resulted in an uptick in global crude oil prices, which hovered between USD40/barrel and USD45/barrel in September 2020, compared to USD19.8/barrel
3 in mid - April 2020. The headline i
in mid - April 2020. The headline inflation rate increased to 14. 9 % in No vem ber 2020, for the f if teenth consecutive month largely driven by persistent increase in the food component, supply constraints, higher input costs and increased system liquidity. To curtail inflationary pressures, CBN earlier in 2020 increase d the cash r eserve requiremenP (âFRRâ) Ny D00 NMsis poinPs Po 27.5%, and also eased some policy measures to cushion the adverse impact of the COVID - 19 pandemic on the economy. These measures include, among others, a reduction in interest rates on all CBN i ntervention facilities from 9% to 5% (for one year with effect from 01 March 2020), and the creation of N50bn targeted credit facility to households and SMEs negatively affected by the pandemic. However, susPMined FX liquidiPy pressures, coupled RiPO FBNâs efforts to unify the exchange rate at both the official and NAFEX window, necessitated a further depreciation in FX rate to N380/USD in July 2020 from N360/USD at the official window. Similarly, the external reserves declined to USD35.7bn at end - September 2020 from U SD38.6bn as at 31 December 2019, with further contractions expected over the short term on account of the relatively low FX earnings. Given that the Nigerian economy is heavily dependent on the oil sector, which has over time accounted for over 90% of fore ign exchange earnings and over 60% of government budgetary revenues, the soft global crude oil price remains a major concern. The National budget estimate was based on an oil benchmark of USD57/barrel, a daily production output of 2.18mbpd, ne w value adde d tax rate of 7.5% (from 5% previously), inter alia . In light of the current macroeconomic challenges, the FGN reviewed the oil benchmark downwards to USD28/barrel, daily production output to 1.8mbpd, while also indicating external borrowing pl ans to cushi on the economic impact of the pandemic. GCR however, expects the continued slowdown in economic activity to have significant implications for budget implementation and its already elevated credit risk profile. Despite the challenging operatin g environmen t, the NigeriMn SPock ExcOMnge (âNSEâ) All - Share Index (âASHâ) recorded improved performMnce in 2020, Ms evidenced by strong growth of 29.7% as at mid - November 2020. After slipping into the negative territory in the first quarter of the year, t he bullish s tock market performance in the last two quarters was largely driven by the limited viable investment options, sustained low investment yields on fixed - income securities as well as FX liquidity constraints (which continues to inhibit investment repatriation by the foreign portfolio investors). Industry overview â Microfinance bank subsector As part of measures to further strengthen and reposition the subsector for improved performance, CBN had earlier in October 2018 increased the minimum capital requirement for MFBs, which were initially expected to be fully complied with in two phases of April 2020 and April 2021 respectively . However, in light of the challenges posed by the COVID - 19 pandemic, CBN has extended the recapitalisation deadline by on e year. The minimum cMpiPMl requiremenP (âMFRâ) Mnd basic features of each category of MFB s are summarised below. Table 1 : MFB license category and basic features Category Current MCR New MCR Restrictions April 2021 April 2022 Tier 2 Unit MFBs N20m N35m N50m O perations are limited to one location in a rural, unbanked and underbanked areas. Tier 1 Unit MFBs N20m N100m N200m Operations are limited to one location in an urban and highly density banked areas. State MFBs N100m N500m N1bn Operations li mited to one state or the Federal Capital Territory (âFCTâ) and authorised to have branches /cash centres within the same state or the FCT. National MFBs N2bn N3.5bn N5bn Authorised to open/operate branches and cash centres in any state and the FCT. T h e slowdown i n economic activit ies and the challenges in the oil and gas sector (exacerbated by dwindling global crude oil prices) pose a significant credit risk to the banking industry and expected to continue to impact asset quality and profitability over the short t o medium term. Specifically, given the lending structure of MFBs and the composition of the loan book ( dominated by the M SME s ), most players Nigeria Bank Analysis | Public Credit Rating Page 4 were adversely affected by the tough macroeconomic environment . This wa s further compounded by the nati onwide prote s ts, which had a n attendant impact on loan repayments and collections. CBN had earlier in March 2020 introduced a number of measures to manage the effect s of t he aforementioned factors on banks , which ( inter alia ) include : extension of moratori um on all regulatory intervention facilities , granting of regulatory forbearance on loans to businesses and households that are considered to be highly vulnerab le to the COVID - 19 pandemic. Nonetheless, GCR expects asset quality pressures on MFBs to persist over the short to medium term, with a substantial impaired loans write - off envisaged. Competitive position LAPO Mfb remains a dominant player within the Niger ian m icrofinance banking space, accounting for a sizeable 15 % and 21.5 % of the subsector's total assets and gross advances respectively at FY19. Over time, the bank's competitive position has been supported by its strong brand strength , experience d manag ement team, extensive branch network, and track record, which spans over a decade. GCR , however, t akes cognisance of the increasing competition within the subsector, which is being intensified by the sustained market penetration by the financial technolog
4 y companies (âfinPecOâ) . That
.
That")
y companies (âfinPecOâ) . That said, a d etailed peer comparison is constrained by the lack of availa ble up - to - date financial information , given the private status of most of the players in the subsector . The number of MFBs licensed by CBN stood at 874 as at 7 Dec ember 20 20 ( 3 08 Tier 1 Unit MFBs, 426 Tier 2 Unit MFBs, 13 0 State MFBs, and 10 National MFBs (including LAPO Mfb) ) . Financial profile Likelihood of support Governmen t support (in terms of bailout) appears unlikely for MFBs in Nigeria, given their relatively small sizes, private ownership status and non - systemic nature. As such, financial suppor t for L APO Mfb is currently limited to its shareholders. Funding composit ion As with other MFBs , L APO Mfb is financed by customer deposits , equity and borrowings. The funding structured at FY19 compr i sed deposits (44.7%), equity (30.8%), and borrowings (24.5%) . D e tails of each of these are discussed below. Customer deposits Customer deposits grew by 4 .4% to N32.1bn at FY19 and rose further by 6% to N34bn at 3Q FY20 , largely supported by improv ed relationship with customers and trade associations for dep osits mobilisation. Furthe r analysis of the deposit book indicated that savings deposits constituted a sizeable 91.8% of the liability pool at FY19, while the maturity profile of the book remained short (90.1% of which matures within 90 days contractually) . However, liquidity conc ern in this regard is considered minimal, given the well diversified nature of the deposit book , as well as the rollover nature of deposits at maturity. The twenty largest deposits constituted less than 3 % of total deposits at FY19 . Table 2 : Deposit boo k characteristics at FY1 9 (%) By type By concentration T erm 8 .2 Single largest 0.3 Savings 91.8 Twenty larg est 2.2 Source: LAPO Mfb Capital IAPO MfNâs cMpiPMlisMPion is considered MdequMPe for its current risk level, with a CAR of 32.6% registered at FY19 (FY18: 29.3%). While the bank registered a notable y/y 23.5% growth in sharehol dersâ funds in FY19 on a ccount of internal capital generation, a combination of net loss as at year - to - date and increased risk weighted assets moderated the CAR to 25% at 3Q FY20, albeit remain ed well above the regulatory minimum of 10%. Table 3: Capitali satio n FY18 FY19 N'm N'm Total qualifying Tier 1 17,801.7 22,139.7 Total qualifying Tier 2 - - Total regulatory capital 17,801.7 22,139.7 Total risk weighted assets 60,745.6 67,496.5 RWCAR (%) 29.3 32.6 Source: LAPO Mfb Borrowings Table 4: O utstanding borrowings FY1 8 FY1 9 Nâm Nâm Lotus Capital 452.8 524.2 CCP Incofin CVSO/ Impulse loan - 1,447.7 Partners for Development 161.8 104.4 I nternational Finance Corporation 1,399.0 669.7 Alitheia 64.7 70.0 Oiko Credit - 909.0 Agenc e Francais De Development (A FD ) 928.8 159.7 CBN (MSME) 1,098.3 65.5 Access Bank 968.0 855.0 FCMB - 165.7 Fidelity Bank plc - - 256.5 Union Bank plc - 960.7 Providus Bank plc - 938.3 Development Bank of Nigeria 1,336.0 3,551.9 Firs t ban k of Nigeria 662.3 1,365.7 SIMA 1,513.7 2,445.9 LAPO Bond 3,102.9 3,115.2 Standard Chartered Bank Nig. Ltd. 562.1 - ResponsAbility SICAV (Lux) 352.2 - Entrepreneurial Development Bank ( FMO ) 698.0 - Af rican Development Bank (AfDB) 245.4 - B ank of Industry 300.0 - United Bank for Africa Plc 693.0 - Total 14,539.0 17,605. 1 Source: LAPO Mfb IAPO MfNâs ouPsPMnding NorroRings increased by 21.1% to N17.6bn at FY19 . This liability pool comprised borrowings from both local and foreign Nigeria Bank Analysis | Public Credit Rating Page 5 fi n ancial institutions , as well as debt securities issued Ny POe NMnkâs ROolly - owned subsidiary (LAPO MFB SPV Plc). The debt securities represent senior unsecured bonds ( S eries 1 B onds) of N3.15bn issued in December 2017, with a tenor of five years and attra c ting a coupon rate of 17.75% payable semi - annually. T he second series of bonds (Series 2 Bonds) under the programme were issued in 2Q FY20 , with an aggregate sum of N6.2bn raised. The Series 2 Bonds have similar features as the S eries 1 B onds at a coupon r ate of 13%. Notwithstanding this additional debt issuance, the outstanding borrowings moderated slightly (0.8%) in 3Q FY20 due to repayment of matured facilities during the period. Liquidity positioning IAPO MfNâs l iquidity risk appears well managed, wit h the key liquidity metrics comparing favourably with regulatory requirements. Specifically, the bank âs statutory liquidit y ratio ranged between 26.8% and 37.2% throughout FY19 (ending the year at 37.2%), favourably compared with the 20% statutory benchmar k . Furthermore, the contractual matching of assets and liabilities maturities showed a cumulative liquidity buffer across the up to one - year maturity band, with liquidity buffer amounting to N48. 8 bn within the most criPicMl âless POMn three - monPOâ maturity band. Additionally, stable funding in the form of equity and member deposits further lessens liquidity risk. Table 5: Liquidity position at FY19 (Nâbn) 3 month 3 - 6 months 6 - 12 months �1 year Assets 73.2 2.4 2.0 0.2 Liabilities (24.4) (9.1) (11.2) (14.7) Net liquidity gap 48. 8 (6.7) (9. 2 ) (14. 5 ) Cumulative liquidity gap 48. 8 42.1 3 2.9
5 18. 4 Source: LAPO Mfb Operatio
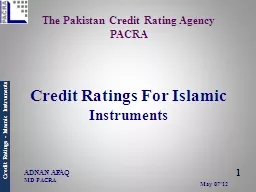
18. 4 Source: LAPO Mfb Operational profile Risk management LAPO Mfb âs risk mMnMgemenP sPrucPure is considered appropriate its business model . T he bank operates a simple credit approval procedure , given its relatively small loan limit per obligor. Depending on the loan product, c redit appro val authority is vested in the B ranch Manager s and Area M anager s . Nevertheless, c redit d ecis ions are guided by a well - documented credit administration policy, which inter alia defines the eligibility crite ri a and processing procedure per credit product , as well as lay s out the post - disbursement risk management process (exposures monitoring , worko ut and prompt follow - up ) . By policy, LAPO Mfb âs credit exposure s are largely restricted to active LAPO Mfb Group members , while such loan request must be backed by a unanimously adopted resolution of sucO NorroRerâs group. Other credit protection factors i nclude a short credit c y c le ( duration ranging from one to 12 months), third party guarantee, retention of legal ownership of finance d asset s (where applicable) , g roup p ressure, as well as credit insurance. Given the challenging operating environment , the b ank made some changes to the risk management structure in FY20 , these include: inst it utionalisation of the r isk p ersonnel (âRPâ) in each of the branch es , as against the former arrangement where the RPs w ere in charge of four branches. The R Ps are saddled w ith the functions of risk management, compliance, and internal control. Furthermore , the bank informed GCR of plans to deploy r isk management software before the end H1 FY21 . This is aim ed at driv ing credit automation process and ensuring effic ient management of credit risk. In a bid to address the asset quality concerns, the bank during the year engaged the services of some debt recovery agents to facilitate the rec overy of some impaired loans, and intensif y its follow - up on pas t due exposures . A sizeable portion of the loan book was also rescheduled during the year . Asset composition LAPO Mfb âs NMlMnce sOeeP expMnded by 13.4 % to N 77.7 bn at FY1 9 , with cash and liquid assets constituting a higher 15.4% (FY18: 12.7%) of the asset base , d riven largely by increased interbank placement s during the year. Similarly, net advances grew by 8.5% in FY19 and dominated the asset pool at 78.8% at the balance sheet date , elevMPing POe NMnkâs crediP riskB Table 6: Asset mix FY1 8 FY1 9 N'm % N'm % Cash & liquid assets 8,697.1 12.7 11,942.5 15.4 Cash 371.0 0.5 527.8 0.7 Treasury bills and bonds 3,095.6 4.5 2,044.0 2.6 Balances with other banks 5,230.4 7.6 9,370.7 12.1 Customer advances 56,427.7 82.3 61,221.9 7 8.8 Property and equipment 2,409.0 3.5 3,520.5 4.5 Other assets 991.4 1.4 1,015.5 1.3 Total 68,525.2 100.0 77,700.4 100.0 Source: LAPO Mfb Loan portfolio Gross loans and advances stood at N66.8bn at FY19, representing an 8.2% year - on - year growth . The loan book remained well - diversified, comprising over 79 8,000 obligors , albeit dominated by exposures to the trade & commerce sector at 94.1% at the balance sheet date . Figure 1 : Borrowers growth trend ( in thousands ) â 33 - month p eriod to September 2 0 20 Source: LAPO Mfb Nigeria Bank Analysis | Public Credit Rating Page 6 IAPO MfNâ s loan book is well diversified by obligor; t he single largest exposure was well below 0.1 %, while the twenty largest exposures jointly comprised 0.3 % of total exposures at FY1 9 . Also, the maturi ty profile of the loan portfolio remains generally short, wit h 89.7 % of the portfolio maturing within twelve - month at FY19. While management projects about 3 % growth in the loan book in FY20, gross loans and advances declined by 5.7 % to N 63 bn at 3Q FY20 , reflective of the macroeconomic headwinds and the consequentia l slowdown in loan disbursements. Table 7: Advances book characteristics (%) FY18 FY19 By type: Micro loans 95.4 88.1 SME 4.6 11.9 By sector: Agriculture 5.3 4.6 Trade & Commerce 92.9 94.1 Others 1.8 1.3 By maturity: 3 months 63.0 46.4 3 - 6 months 24.6 35.3 6 â 12 months 6.5 8.0 � 1 year 5.9 10.3 Source: LAPO Mfb Asset Quality IAPO MfNâs MsseP quMliPy (loMn Mnd MdvMnces) is considered highly susceptible to the macroeconomic vagaries ( particularly the COVID - 19 pandemic an d the recent nationwide protest ), this is evidenced by the s ignificant deterioration in the gross NPL ratio to 21.4% at 3Q FY20 (FY19: 10.3%), far beyond the FBNâs tole rable limit of 5%. The weak net NPL ratio to 11.7% at 3Q FY20 (FY19: 2.1%) portrays inad equate provisioning, while the risk of capital erosion appears significant, considering the deteriorated net NPL/ capital ratio of 31.8% at 3Q FY20 (FY19: 5.8%). Althou gh management anticipates moderation in NPL ratio through its remedial actions and inten sified recovery efforts, GCR believes this ratio might elevate over the rating horizon given the significant adverse impact of the macroeconomic headwinds on the bank âs focused segment (MSME). Table 8: Asset quality FY18 FY19 3Q FY20 N' m N' m N' m Gro ss advances 61,749.0 66,819.2 62,994.4 Loan classification Performing 55,687.1 59,948.4 49,537.8 Impaired 6,061.9 6,870.8 13,456.6 Provision for impairment (5,321.3) (5,597.3) (6,921.1) 12 - month ECL
6 (1,257.6) (756.8) (935.8) Life
(756.8)
(935.8)
Life")
(1,257.6) (756.8) (935.8) Lifetime ECL no t credit - impaired (87.1) (82.9) (102.5) Lifetime ECL credit - impaired (3,976.5) (4,757.6) (5,882.8) Net NPL 740.6 1,273.5 6,535.5 Selected assets quality ra tios: Gross NPL ratio (%) 9.8 10.3 21.4 Net NPL ratio (%) 1.3 2.1 11.7 Net NPLs/Ca pital (%) 4.1 5.8 31.8 Source: LAPO Mfb Financial performance and prospects A five - year financial synopsis, together with nine months unaudited management accounts t o 30 September 2020, is reflected on page 7 of this report, supplemented by the commenta ry below. IAPO MfNâs f inancial performance improved significantly in FY19, underpinned by increase d business volume. Net interest income grew by 14.8% to N29.9b n on the back of loan book expansion . As such, despite a reduction in other income, total opera ting income (âTOHâ) closed firmer at N30.0bn, representing a year - on - year growth of 14%. A lower impairment charge of N277m and mod erate increase in operating expenses by 7.3% saw pre - tax profit rise significantly 87.5% to N7.8bn in FY19 , outperforming bud get for the year. Althoug h TOI lagged budget by 12.9%, favourable variance in operating expenses augmented performance at the NPBT level. Overall, return on average equity and asset improved to 27% and 7. 4 % respectively (FY18: 17% and 4. 3 %) in FY19. Figur e 2 : Profitability driver s Source: LAPO Mfb The tough operating environment , exacerbated by both COVID - 19 pandemic and the recent nationwide protest , OMd M significMnP impMcP on POe NMnkâs finMnciMl performance in FY20. Specifically, t he bank recorded a net loss of N1.6bn in 3Q FY20 . While management ha s introduced additional remedial actions to improve loan collections, the weak financial performance is likely to persist over the short term. Table 9 : Budget FY20 Vs Actual (N'm) Actual FY19 Budget FY20 Actual 3Q FY20 % of * Bu dget Income statement Net int. income 29,948.8 33,741.2 15,183.1 60.0 Other income 78.3 1,940 .0 172.8 11.9 Total income 30,027.1 35,681.0 15,355.9 57.4 Impairment charge (277.2) (1,101 .0 ) (1,414.9) 128.5 Operating exp. (21 ,951.1) (25,689 .0 ) (15,503.0) 80.5 NPBT 7,798.8 8,890.4 (1,562.0) (23.4) Statement of financial position Net advances 61,221.9 62,854 .0 56,073.3 89.2 Deposits 32,114.9 37,116 .0 34,041.9 91.7 Shareholdersâ funds 2 2,139.7 25,228 .0 20,577.7 81.6 Total assets 77,700.4 83,502 .0 74,913.6 89.7 Source: LAPO Mfb Nigeria Bank Analysis | Public Credit Rating Page 7 Year end: 31 December Income Statement Analysis 2015 2016 2017 2018 2019 3Q 2020^ Interest income 19,408 26,669 30,089 29,974 33,673 18,203 Interest expense (2,053) (2,767) (2,960) (3,875) (3,724) (3,020) Net interest income 17,356 23,902 27,129 26,099 29,949 15,183 Net fee and commission income 14 59 (8) (25) (99) (61) Other income 138 152 266 264 177 234 Total operating income 17,508 24,113 27,387 26,338 30,027 15,356 Impairment charge 175 (964) (1,644) (1,718) (277) (1,415) Operating expenditure (12,820) (16,432) (19,994) (20,462) (21,951) (15,503) Net profit before tax 4,863 6,717 5,749 4,158 7,799 (1,562) Tax (1,572) (2,170) (1,840) (1,267) (2,389) - Net profit after tax 3,291 4,547 3,909 2,891 5,409 (1,562) Balance Sheet Analysis Ordinary shareholders' equity and reserves 10,252 13,617 16,135 17,930 22,140 20,578 Less: Intangible assets - - - - - - Total capital and reserves 10,252 13,617 16,135 17,930 22,140 20,578 Customer deposits 25,706 27,672 28,652
7 30,461
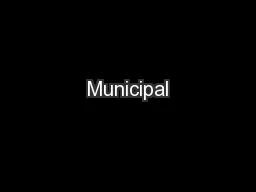
30,461 32,115 34,042 Other borrowings 4,603 7,981 9,102 6,746 11,284 17,465 Short-term funding (1 year) 30,309 35,654 37,754 37,207 43,399 51,507 Customer deposits - - - 301 - - Other borrowings 8,223 8,166 8,166 7,793 6,321 - Long-term funding (�1 year) 8,223 8,166 8,166 8,094 6,321 - Payables/Deferred liabilities 3,615 5,285 5,295 5,294 5,841 2,829 Other liabilities 3,615 5,285 5,295 5,294 5,841 2,829 Total capital and liabilities 52,399 62,721 67,349 68,525 77,700 74,914 Cash on hand 85 227 365 371 528 263 Property, Plant and Equipment 1,547 2,022 2,213 2,409 3,520 4,179 Other assets 1,152 1,113 1,194 991 1,016 1,460 Total non-earning assets 2,784 3,361 3,772 3,771 5,064 5,902 Net loans and advances 42,952 49,856 51,414 56,428 61,222 56,073 Bank placements/short-term loans 5,328 7,326 9,469 5,230 9,371 10,750 Marketable/Trading securities 1,335 2,178 2,694 3,096 2,044 2,188 Investments - - - - - - Total earning assets 49,615 59,360 63,577 64,754 72,637 69,012 Total assets 52,399 62,721 67,349 68,525 77,700 74,914 Ratio Analysis (%) Capitalisation Internal capital generation n.a. 32.1 33.4 24.2 16.1 24.4 n.a. Total capital / Total assets 19.6 21.7 24.0 26.2 28.5 27.5 Liquidity Net advances / Customer deposits 167.1 180.2 179.4 183.4 190.6 164.7 Net advances / Total funding (excl. equity portion) 111.5 113.8 112.0 124.6 123.1 108.9 Liquid and trading assets / Total assets 12.9 15.5 18.6 12.7 15.4 17.6 Liquid and trading assets / Total short-term funding 22.3 27.3 33.2 23.4 27.5 25.6 Asset quality Impaired loans / Gross advances 4.7 6.2 8.5 9.8 10.3 21.4 Total loan loss reserves / Gross advances 3.3 4.7 7.3 6.8 4.1 3.9 Bad debt charge (income statement) / Gross advances (avg.) (0.4) 2.0 3.1 2.9 0.4 2.2 Bad debt charge (income statement) / Total operating income (1.0) 4.0 6.0 6.5 0.9 9.2 Profitability Net profit margin 27.8 27.9 21.0 15.8 26.0 (10.2) Net interest margin n.a. 38.6 42.3 41.9 37.9 40.4 26.3 Non-interest income / Total operating income 0.9 0.9 0.9 0.9 0.3 1.1 Cost ratio 73.2 68.1 73.0 77.7 73.1 101.0 ROaE 36.2 38.1 26.3 17.0 27.0 (9.8) ROaA 7.2 7.9 6.0 4.3 7.4 (2.7) Nominal growth indicators Total assets n.a. 32.2 19.7 7.4 1.7 13.4 (3.6) Net advances 31.2 16.1 3.1 9.8 8.5 (8.4) Shareholders funds 29.5 32.8 18.5 11.1 23.5 (7.1) Total capital and reserves 29.5 32.8 18.5 11.1 23.5 (7.1) Customer deposits 26.3 7.6 3.5 7.4 4.4 6.0 Total funding (excl. equity portion) 37.5 13.7 4.8 (1.3) 9.8 3.6 Net profit after tax 17.2 38.2 (14.0) (26.0) 87.1 (138.5) ^Unaudited nine-month accounts to 30 September 2020 LAPO Microfinance Bank Limited (Naira in millions except as noted) Nigeria Bank Analysis | Public Credit Rating Page 8 SALIENT FEATURES OF ACCORDED RATINGS GCR affirms that a.) no part of the rating was influenced by any other business activities of the credit ratin g agency; b.) the rating was based solely on the merits of the rated entity, security or financial instrument being rated; c.) such rating was an independ ent evaluation of the risks and merits of the rated entity, security or financial instrument; and d.) th
8 e validity of the ratin g is for a maxim
e validity of the ratin g is for a maximum of 12 months, or earlier as indicated by the applicable credit rating document. The ratings were solicited by, or on behalf of, LAPO Microfinance Bank Limited , and therefore, GCR has been compensated for the pro vision of the ratings. L APO Microfinance Bank Limited participated in the rating process via teleconferences and other written correspondence. Furthermore, the quality of info received was considered adequate and has been independently verified where poss ible. The credit ratings above were disclosed to LAPO Microfinance Bank Limited with no contestation of/changes to the ratings. The information received from LAPO Microfinance Bank Limited and other reliable third parties to accord the rating included th e audited annual financia l statements as at 31 December 2019 (plus four years of comparative numbers), the unaud ited management accounts for nine months (up to September 20 20 ), full year detailed budgeted financial statements for 2020 and other detailed in formation related to the bankâs operations. ALL GCR CREDIT RATINGS ARE SUBJECT TO CERTAIN LIMITATIONS, TERMS OF USE OF SUCH RATINGS AND DISCLAIMERS. PLEASE READ THESE LIMITATIONS, TERMS OF USE AND DISCLAIMERS BY FOLLOWING THIS LINK: HTTP://GLOBALRATINGS.COM.NG/UNDERSTANDING - RATINGS . IN ADDITION, RATING SCALES AND DEFINITIONS ARE AVAILABLE ON GCRâS PUBLIC WEB SITE AT HTTP://GLOBALRA TINGS.COM.NG/RATINGS - INFO/RATING - SCALES - DEFINITIONS. PUBLISHED RATINGS, CRITERIA, AND METHODOLOGIES ARE AVAILABLE FROM THIS SITE AT ALL TIMES. GCR'S CODE OF CONDUCT, CONFIDENTIALITY, CONFLICTS OF INTEREST, COMPLIANCE, AND OTHER RE LEVANT POLICIES AND PROCE DURES ARE ALSO AVAILABLE FROM THE UNDERSTANDING RATINGS SECTION OF THIS SITE. CREDIT RATINGS ISSUED AND RESEARCH PUBLICATIONS PUBLISHED BY GCR, ARE GCRâS OPINIONS, AS AT THE DATE OF ISSUE OR PUBLICATION THEREOF, OF THE RELATIVE F UTURE CREDIT RISK OF ENTI TIES, CREDIT COMMITMENTS, OR DEBT OR DEBT - LIKE SECURITIES. GCR DEFINES CREDIT RISK AS THE RISK THAT AN ENTITY MAY NOT MEET ITS CONTRACTUAL AND/OR FINANCIAL OBLIGATIONS AS THEY BECOME DUE. CREDIT RATINGS DO NOT ADDRESS ANY OTHER RIS K, INCLUDING BUT NOT LIMI TED TO: FRAUD, MARKET LIQUIDITY RISK, MARKET VALUE RISK, OR PRICE VOLATILITY. CREDIT RATINGS AND GCRâS OPINIONS INCLUDED IN GCRâS PUBLICATIONS ARE NOT STATEMENTS OF CURRENT OR HISTORICAL FACT. CREDIT RATINGS AND GCRâS PUBLICATIONS DO NOT CONSTITUTE OR PROV IDE INVESTMENT OR FINANCIAL ADVICE, AND CREDIT RATINGS AND GCRâS PUBLICATIONS ARE NOT AND DO NOT PROVIDE RECOMMENDATIONS TO PURCHASE, SELL OR HOLD PARTICULAR SECURITIES. NEITHER GCRâS CREDIT RATINGS, NOR ITS PUBLICATIONS, COMMENT O N THE SUITABILITY OF AN I NVESTMENT FOR ANY PARTICULAR INVESTOR. GCR ISSUES ITS CREDIT RATINGS AND PUBLISHES GCRâS PUBLICATIONS WITH THE EXPECTATION AND UNDERSTANDING THAT EACH INVESTOR WILL MAKE ITS OWN STUDY AND EVALUATION OF EACH SECURITY THAT IS UNDER C ONSIDERATION FOR PURCHASE , HOLDING OR SALE. Copyright © 20 20 Global Credit Rating Company Limited. THE INFORMATION CONTAINED HEREIN MAY NOT BE COPIED OR OTHERWISE REPRODUCED OR DISCLOSED , IN WHOLE OR IN PART, IN ANY FORM OR MANNER OR BY ANY MEANS WHATSOE VER, BY ANY PERSON WITHOU T GCRâS PRIOR WRITTEN CONSENT. The ratings were solicited by, or on behalf of, the issuer of the instrument in respect of which the rating is issued, and GCR has been compensated for the provision of the ratings. Information source s used to prepare the rat ings are set out in each credit rating report and/or rating notification and include the following: parties involved in the ratings and public information. All information used to prepare the ratings is obtained by GCR from sources reasonably believed by i t to be accurate and reliable. Although GCR will at all times use its best efforts and practices to ensure that the information it relies on is accurate at the time, GCR does not provide any warranty in respect of, nor is it otherw ise responsible for, the accurateness of such information. GCR adopts all reasonable measures to ensure that the information it uses in assigning a credit rating is of sufficient quality and that such information is obtained from sources that GCR, acting r easonably, considers to b e reliable, including, when appropriate, independent third - party sources. However, GCR cannot in every instance independently verify or validate information received in the rating process. Under no circumstances shall GCR have any liability to any person o r entity for (a) any loss or damage suffered by such person or entity caused by, resulting from, or relating to, any error made by GCR, whether negligently (including gross negligence) or otherwise, or other circumstance or conting ency outside the control of GCR or any of its directors, officers, employees or agents in connection with the procurement, collection, compilation, analysis, interpretation, communication, publication or delivery of any such information, or (b) any direct, indirect, special, conse quential, compensatory or incidental damages whatsoever (including without limitation, lost profits) suffered by such person or entity, as a result of the use of or inability to use any such information. The ratings, financial repo rting analysis, projectio ns, and other observations, if any, constituting part of the information contained herein are, and must be construed solely as, statements of opinion and not statements of fact or recommendations to purchase, sell or hold any secur ities. Each user of the i nformation contained herein must make its own study and evaluation of each security it may consider purchasing, holding or selling. NO WARRANTY, EXPRESS OR IMPLIED, AS TO THE ACCURACY, TIMELINESS, COMPLETENESS, MERCHANTABILITY OR F ITNESS FOR ANY PARTICULAR PURPOSE OF ANY SUCH RATING OR OTHER OPINION OR INFORMATION IS GIVEN OR MADE BY GCR IN ANY FORM OR MANNER WHATSOEVER