
DMSs and dietary intake and lifestyle factors at exam 5 for all participants n1880 log10 P value 60 50 40 30 20 10 132 NutrientsBioactive 129 Food group1 FFD 29 Food group2 FG5Serv ID: 915160
Download Presentation The PPT/PDF document "Supplemental Figure 1A: Association betw..." is the property of its rightful owner. Permission is granted to download and print the materials on this web site for personal, non-commercial use only, and to display it on your personal computer provided you do not modify the materials and that you retain all copyright notices contained in the materials. By downloading content from our website, you accept the terms of this agreement.


Slide1
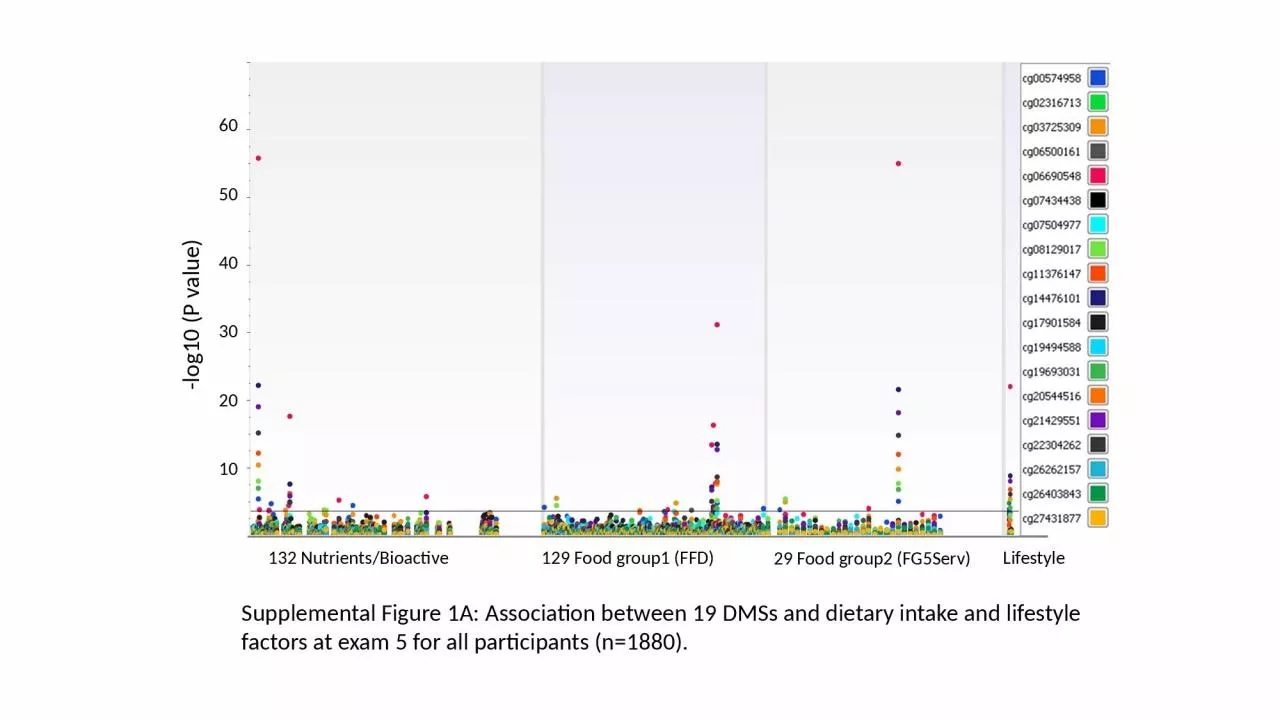
Supplemental Figure 1A: Association between 19 DMSs and dietary intake and lifestyle factors at exam 5 for all participants (n=1880).
-log10 (P value)
60
50
40
30
20
10
132 Nutrients/Bioactive
129 Food group1 (FFD)
29 Food group2 (FG5Serv)
Lifestyle
Slide2Supplemental Figure 1B: Association between 19 DMSs and dietary intake and lifestyle factors at exam 5 for those participants (n=1710)
not taking lipid-lowering medication.
-log10 (P value)
60
50
40
30
20
10
132 Nutrients/Bioactive
129 Food group1 (FFD)
29 Food group2 (FG5Serv)
Lifestyle and
medication
Slide3Supplemental Figure 2A: Association between 19 DMSs and dietary intake and lifestyle factors at exam 6 for all participants (n=1985).
-log10 (P value)
60
50
40
30
20
10
106 Nutrients/Bioactive
129 Food group1 (FFD)
29 Food group2 (FG5Serv)
Lifestyle
Slide4Supplemental Figure 2B: Association between 19 DMSs and dietary intake and lifestyle factors at exam 6 for those participants not taking lipid-lowering medication (n=1746)
-log10 (P value)
60
50
40
30
20
10
106 Nutrients/Bioactive
129 Food group1 (FFD)
29 Food group2 (FG5Serv)
Lifestyle and
Medications
Slide5Supplemental Figure 3A: Association between 19 DMSs and dietary intake and lifestyle factors at exam 7 of all participants (n=2014).
-log10 (P value)
60
50
40
30
20
10
151 Nutrients/Bioactive
129 Food group1 (FFD)
29 Food group2 (FG5Serv)
Lifestyle
Slide6Supplemental Figure 3B: Association between 19 DMSs and dietary intake and lifestyle factors at exam 7 for those participants not taking lipid-lowering medication (n=1618).
-log10 (P value)
60
50
40
30
20
10
151
Nutrients/Bioactive
129 Food group1 (FFD)
29 Food group2 (FG5Serv)
Lifestyle and
Medication
Slide7cg03725309
cg14476101
cg19693031
cg06690548
cg21429551 cg07504977
cg11376147 cg00574958
cg20544516 cg08129017
cg22304262
Beer
Red WineWhite Wine
LiquorExam
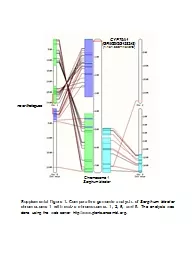
Supplemental Figure 4. Natural indirect effects (NIE) of four types of alcohol drinks (servings/week)
on plasma TG via epigenetic
mediators.
P
≤0.0045
P
>0.0045
Slide8Beer
Red Wine
White Wine
Liquor
cg03725309
cg14476101
cg19693031
cg06690548
cg21429551
cg07504977 cg11376147
cg00574958 cg20544516
cg08129017 cg22304262
Supplemental Figure 5. Natural direct effects (NDE) of four types of alcohol drinks (servings/week) on plasma TG without epigenetic mediators.
Exam
P
≤0.0045
P
>0.0045