
The impacts of a PAYE reform on taxable earnings in Uganda1Maria Jouste12 Tina Kaidu3 Joseph Okello3 Jukka Pirttil245 and Pia Rattenhuber21Department of Economics Universityof Turku Turku Finland2UNU ID: 870239
Download Pdf The PPT/PDF document "Research brief" is the property of its rightful owner. Permission is granted to download and print the materials on this web site for personal, non-commercial use only, and to display it on your personal computer provided you do not modify the materials and that you retain all copyright notices contained in the materials. By downloading content from our website, you accept the terms of this agreement.


1 Research brief: The impacts of a
Research brief: The impacts of a PAYE reform on taxable earnings in Uganda 1 Maria Jouste 1,2 , Tina Kaidu 3 , Joseph Okello 3 , Jukka Pirttilä 2,4 ,5 , and Pia Rattenhuber 2 1 Department of Economics, University of Turku, Turku, Finland 2 UNU - WIDER, Helsinki, Finland 3 Uganda Revenue Authority, Kampala, Uganda 4 University of Helsinki, Helsinki, Finland 5 VATT Institute for Economic Research Summary The paper uses administrative tax data from the Uganda Revenue Authority to examine the impacts of the 2012/13 reform, where taxes on individual earnings (collected using the pay - as - you - earn system , PAYE ) were changed. In particular, we focus on top taxpayers (with earnings exceeding UGX 10 million a month) whose highest marginal tax rate increased from 30 to 40 per cent. The top group represents one per cent of income earners, and we compare their earnings developments before and after to reform to other taxpayers (our control group) in the top 10 per cent of taxpayers, whose marginal tax rate did not change. We find that the top group earnings declined by around 10 per cent in comparison to the control group earnings in the period after the reform. This reduction implies that while the additional tax bracket of 10 per cent led to increased tax revenues, the revenue increase would have been approximately 1 5 per cent greater had there not been a reduction in earnings among the top earners. Background Uganda reformed its personal income tax and the pay - as - you earn (tax on individual earnings withdrawn by the employers) tax system starting from the fiscal year 2012/13. The reform increased the lower threshold of the tax brackets, resulting in a reduction of the tax burden for low and middle income earners , and it also introduced a new tax bracket for people with earnings exceeding UGX 10 million a month, whose highest marginal tax rate increased from 30 to 40 per cent. The purpose of the re form was to allow relief for inflation for lower income groups and recoup revenues by increasing the tax rate on high - income groups. Such a reform may induce behavioural responses among the taxpayers. They may choose to start working less or , if they own businesses, try obtaining compensation in other forms, such as capital income, instead. Such behavioural reactions are summarized in a concept known as The Elasticity of Taxable Income (ETI for short), which is defin
2 ed to be the proportional change in tax
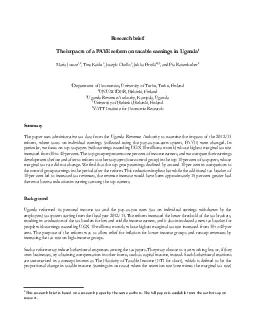
ed to be the proportional change in tax able income (earnings in our case) when the retention rate (one minus the marginal tax rate) 1 This research brief is based on a research paper by the same authors. The full paper is available from the authors upon request. 2 changes by one per cent. There is a large body of literature estimating ETI in economics literature, and it is summarized for instance by Saez et al. (2012) 2 for the case of developed countries . Data and methods This paper uses the universe of the administrative payroll tax data extracted from the information system of the Uganda Revenue Authority for the fiscal years 2010/11 to 2014/15 . We seek to estimate the e lasticity of taxable earnings for the top taxpayer group (the treatment group), whose marginal tax rate increased, using those below them in the earnings distribution as the control group (the rest of the taxpayers among top 10%). We use data from both bef ore and after the reform and the so - called difference - in - difference method to study relative income changes between the groups. If we detect that the earnings of the treatment group whose tax burden increased decline relative to the earnings for the contro l group, this may be due to the tax reform or some other simultaneous trends that would have lowered earnings inequality in the country. Results We first summarize income trends for the treatment and control groups in the Figure below. The F igure suggests that while the income growth trends were fairly similar for the treated and the control group before the reform, the trends diverged after the re form: earnings fell for the top taxpayers who saw on increase in their marginal tax rate. Actual difference - in - difference regressions, where we control for permanent differences between the groups and for common year and month effects, confirm the inform ation from the figure. These results, which are reported in the Table below, suggest that according to the basic OLS regression (without weights), the drop in incomes for the treated group was around 7 per cent (Column 1) . This corresponds with an elastici ty equal to approximately 0.5, which is somewhat larger than corresponding estimates in the literature. When using income weights in the estimation, the estimate increases drastically (Column 2). However, further analysis shows that when one censors some o utlier observations (top 1% of the treatment group), th
3 e elasticity estimates drop. This sugges
e elasticity estimates drop. This suggests that the very high elasticities are driven by few large outlie r observations. We have also examined the robustness of this result by splitting the treatmen t group into two halves and by focusing on the same set of taxpayers across the years. This analysis reveals that the response is greater for the upper half of the treatment group and that the elasticities decline when the same panel of taxpaying firms is used. According to our calculations, the top taxpayers paid approximately UGX 400 billion in taxes a year . Without a decline in the earnings as reported by the employers of the top tax payers, this revenue impact w ould have been approximately 12 per cent greater . However, it is possible that not all of the income decline among the treatment group is due to the reform and that some of the income may have become taxable as capital income instead. Therefore, the estimates for the revenue implications of the top tax rate need to interpreted cautiously. 2 Saez, E., Slemrod, J., & Giertz, S. H. (2012). The Elasticity of Taxable Income with Respect to Marginal Tax Rates: A Criti cal Review. Journal of Economic Literature , 50 (1), 3 â 50. 3 Figure . Mean earnings for treatment group ( Top 1% taxpayers ) and control group (Next 9% ) Notes: Incomes are normalized to one for both groups in 2011/12. The vertical line indicates the reform year . Source: Authorsâ own calculations based URA PAYE administrative tax records. Table . Difference - in - difference (DiD) regression results . Notes: Columns ( 2 ) and (4) present weighted least squares estimates with income used as weights. In Columns ( 3 ) and (4), incomes exceeding the top 1% threshold among the treated group (that is, income above 0.01% of all income earners) are censored to the threshold value . S tandard errors that are clustered at the firm level are in parentheses . *** p0.01, ** p.05, * p.1 Source: Authorsâ own calculations. Treated: Top 1% Treated: Top 1%, censored (1) (2) (3) (4) Simple Weighted Simple Weighted Basic: DiD estimate - 0.0 743 ** - 0.3 19 ** - 0.07 29 ** - 0.1 75 *** (0. 0345 ) (0.1 31 ) (0.0 344 ) (0.0 624 ) Year and month dummies Yes Yes Yes Yes R - squared 0.5 58 0.6 22 0.56 0.70 1 Implied elasticity 0.5 201 2.2 33 0.5 103 1.2 25