
2 H Morement 1 D Tataru 3 L Paley 3 and S A Khan 2 1 AMMF Essex UK 2 Faculty of Medicine Imperial College London UK 3 National Cancer Registration and Analysis Service ID: 1034878
Download Presentation The PPT/PDF document "T Genus 1,3 , M B Toledano" is the property of its rightful owner. Permission is granted to download and print the materials on this web site for personal, non-commercial use only, and to display it on your personal computer provided you do not modify the materials and that you retain all copyright notices contained in the materials. By downloading content from our website, you accept the terms of this agreement.


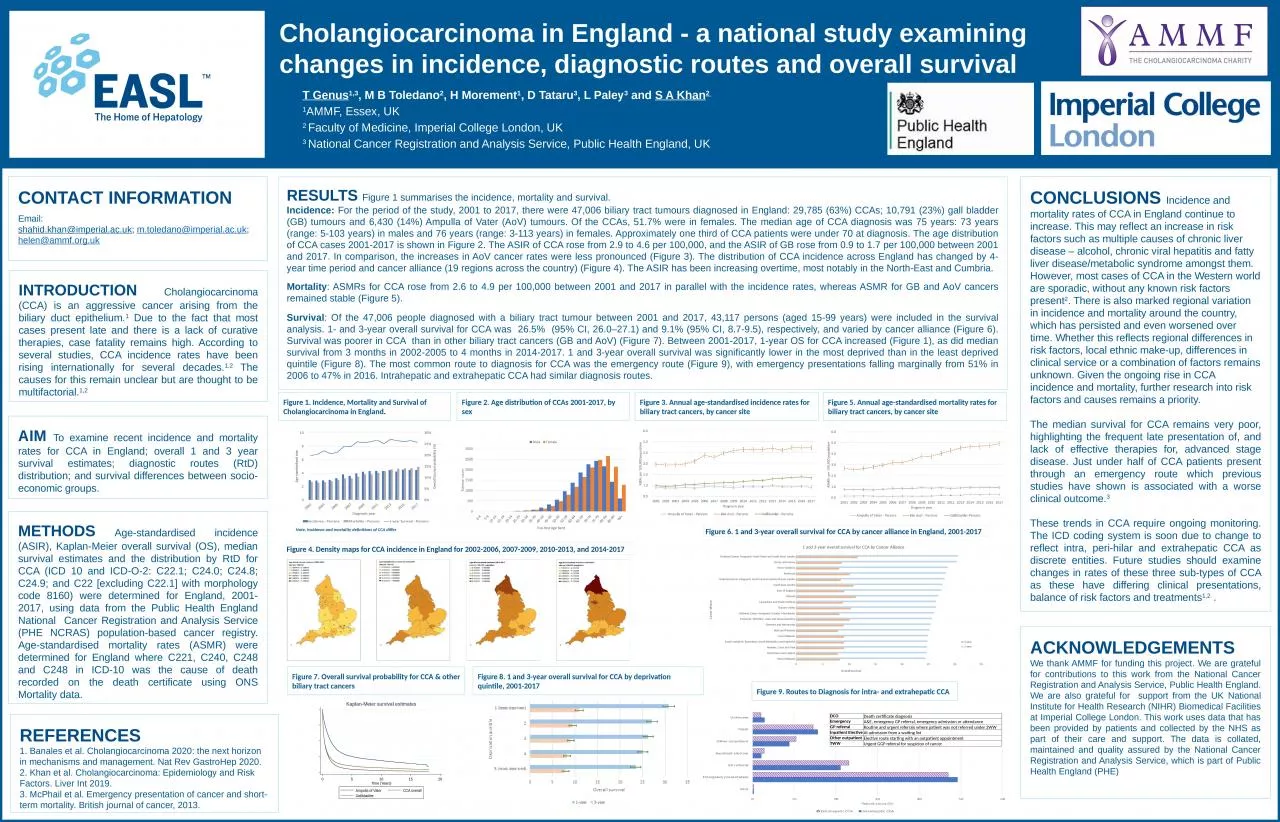
1. T Genus1,3, M B Toledano2, H Morement1, D Tataru3, L Paley3 and S A Khan2 1AMMF, Essex, UK2 Faculty of Medicine, Imperial College London, UK3 National Cancer Registration and Analysis Service, Public Health England, UKCholangiocarcinoma in England - a national study examining changes in incidence, diagnostic routes and overall survival Introduction Cholangiocarcinoma (CCA) is an aggressive cancer arising from the biliary duct epithelium.1 Due to the fact that most cases present late and there is a lack of curative therapies, case fatality remains high. According to several studies, CCA incidence rates have been rising internationally for several decades.1,2 The causes for this remain unclear but are thought to be multifactorial.1,2Conclusions Incidence and mortality rates of CCA in England continue to increase. This may reflect an increase in risk factors such as multiple causes of chronic liver disease – alcohol, chronic viral hepatitis and fatty liver disease/metabolic syndrome amongst them. However, most cases of CCA in the Western world are sporadic, without any known risk factors present2. There is also marked regional variation in incidence and mortality around the country, which has persisted and even worsened over time. Whether this reflects regional differences in risk factors, local ethnic make-up, differences in clinical service or a combination of factors remains unknown. Given the ongoing rise in CCA incidence and mortality, further research into risk factors and causes remains a priority.The median survival for CCA remains very poor, highlighting the frequent late presentation of, and lack of effective therapies for, advanced stage disease. Just under half of CCA patients present through an emergency route which previous studies have shown is associated with a worse clinical outcome.3These trends in CCA require ongoing monitoring. The ICD coding system is soon due to change to reflect intra, peri-hilar and extrahepatic CCA as discrete entities. Future studies should examine changes in rates of these three sub-types of CCA as these have differing clinical presentations, balance of risk factors and treatments1,2 .MethodS Age-standardised incidence (ASIR), Kaplan-Meier overall survival (OS), median survival estimates and the distribution by RtD for CCA (ICD 10 and ICD-O-2: C22.1; C24.0; C24.8; C24.9; and C22 [excluding C22.1] with morphology code 8160) were determined for England, 2001-2017, using data from the Public Health England National Cancer Registration and Analysis Service (PHE NCRAS) population-based cancer registry. Age-standardised mortality rates (ASMR) were determined for England where C221, C240, C248 and C248 in ICD-10 was the cause of death recorded on the death certificate using ONS Mortality data.AcknowledgementsWe thank AMMF for funding this project. We are grateful for contributions to this work from the National Cancer Registration and Analysis Service, Public Health England. We are also grateful for support from the UK National Institute for Health Research (NIHR) Biomedical Facilities at Imperial College London. This work uses data that has been provided by patients and collected by the NHS as part of their care and support. The data is collated, maintained and quality assured by the National Cancer Registration and Analysis Service, which is part of Public Health England (PHE)AIM To examine recent incidence and mortality rates for CCA in England; overall 1 and 3 year survival estimates; diagnostic routes (RtD) distribution; and survival differences between socio-economic groups.References1. Banales et al. Cholangiocarcinoma 2020: the next horizon in mechanisms and management. Nat Rev GastroHep 2020.2. Khan et al. Cholangiocarcinoma: Epidemiology and Risk Factors. Liver Int 2019.3. McPhail et al. Emergency presentation of cancer and short-term mortality. British journal of cancer, 2013.RESULTS Figure 1 summarises the incidence, mortality and survival.Incidence: For the period of the study, 2001 to 2017, there were 47,006 biliary tract tumours diagnosed in England: 29,785 (63%) CCAs; 10,791 (23%) gall bladder (GB) tumours and 6,430 (14%) Ampulla of Vater (AoV) tumours. Of the CCAs, 51.7% were in females. The median age of CCA diagnosis was 75 years: 73 years (range: 5-103 years) in males and 76 years (range: 3-113 years) in females. Approximately one third of CCA patients were under 70 at diagnosis. The age distribution of CCA cases 2001-2017 is shown in Figure 2. The ASIR of CCA rose from 2.9 to 4.6 per 100,000, and the ASIR of GB rose from 0.9 to 1.7 per 100,000 between 2001 and 2017. In comparison, the increases in AoV cancer rates were less pronounced (Figure 3). The distribution of CCA incidence across England has changed by 4-year time period and cancer alliance (19 regions across the country) (Figure 4). The ASIR has been increasing overtime, most notably in the North-East and Cumbria. Mortality: ASMRs for CCA rose from 2.6 to 4.9 per 100,000 between 2001 and 2017 in parallel with the incidence rates, whereas ASMR for GB and AoV cancers remained stable (Figure 5). Survival: Of the 47,006 people diagnosed with a biliary tract tumour between 2001 and 2017, 43,117 persons (aged 15-99 years) were included in the survival analysis. 1- and 3-year overall survival for CCA was 26.5% (95% CI, 26.0–27.1) and 9.1% (95% CI, 8.7-9.5), respectively, and varied by cancer alliance (Figure 6). Survival was poorer in CCA than in other biliary tract cancers (GB and AoV) (Figure 7). Between 2001-2017, 1-year OS for CCA increased (Figure 1), as did median survival from 3 months in 2002-2005 to 4 months in 2014-2017. 1 and 3-year overall survival was significantly lower in the most deprived than in the least deprived quintile (Figure 8). The most common route to diagnosis for CCA was the emergency route (Figure 9), with emergency presentations falling marginally from 51% in 2006 to 47% in 2016. Intrahepatic and extrahepatic CCA had similar diagnosis routes. Figure 1. Incidence, Mortality and Survival of Cholangiocarcinoma in England.CONTACT INFORMATION Email: shahid.khan@imperial.ac.uk; m.toledano@imperial.ac.uk; helen@ammf.org.uk Figure 4. Density maps for CCA incidence in England for 2002-2006, 2007-2009, 2010-2013, and 2014-2017Figure 2. Age distribution of CCAs 2001-2017, by sex Figure 3. Annual age-standardised incidence rates for biliary tract cancers, by cancer site Figure 5. Annual age-standardised mortality rates for biliary tract cancers, by cancer site Figure 6. 1 and 3-year overall survival for CCA by cancer alliance in England, 2001-2017Figure 7. Overall survival probability for CCA & other biliary tract cancersFigure 9. Routes to Diagnosis for intra- and extrahepatic CCADCODeath certificate diagnosisEmergencyA&E, emergency GP referral, emergency admission or attendanceGP referralRoutine and urgent referrals where patient was not referred under 2WWInpatient ElectiveAt admission from a waiting list Other outpatientElective route starting with an outpatient appointmentTWW Urgent GGP referral for suspicion of cancerFigure 8. 1 and 3-year overall survival for CCA by deprivation quintile, 2001-2017Note, incidence and mortality definitions of CCA differ