
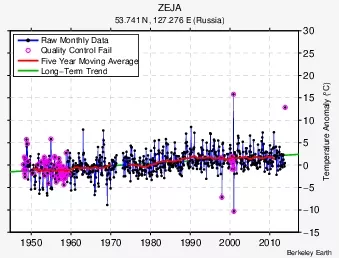
195019601970198019902000201015105051015202530Raw Monthly DataQuality Control FailFive Year Moving AverageLongTerm TrendZEJA53741 N 127276 E RussiaBerkeley Earth ID: 858678
Download Pdf The PPT/PDF document "Temperature Anomaly C" is the property of its rightful owner. Permission is granted to download and print the materials on this web site for personal, non-commercial use only, and to display it on your personal computer provided you do not modify the materials and that you retain all copyright notices contained in the materials. By downloading content from our website, you accept the terms of this agreement.


1 1950 1960 1970 1980 1990 2000 2010 -15 -
1950 1960 1970 1980 1990 2000 2010 -15 -10 -5 0 5 10 15 20 25 30 Temperature Anomaly (°C) Raw Monthly Data Quality Control Fail Five Year Moving Average Long-Term Trend ZEJA53.741 N, 127.276 E (Russia)Berkeley Earth