
Durand B Zanella G BiteauCoroller F Locatelli C Baurier F Simon C et al Anatomy of Bluetongue virus Serotype 8 Epizootic Wave France 20072008 Emerg Infect Dis 2010161218611868 httpsdoiorg103201eid1612100412 ID: 1035778
Download Presentation The PPT/PDF document "Figure 2 Figure 2. Results from..." is the property of its rightful owner. Permission is granted to download and print the materials on this web site for personal, non-commercial use only, and to display it on your personal computer provided you do not modify the materials and that you retain all copyright notices contained in the materials. By downloading content from our website, you accept the terms of this agreement.


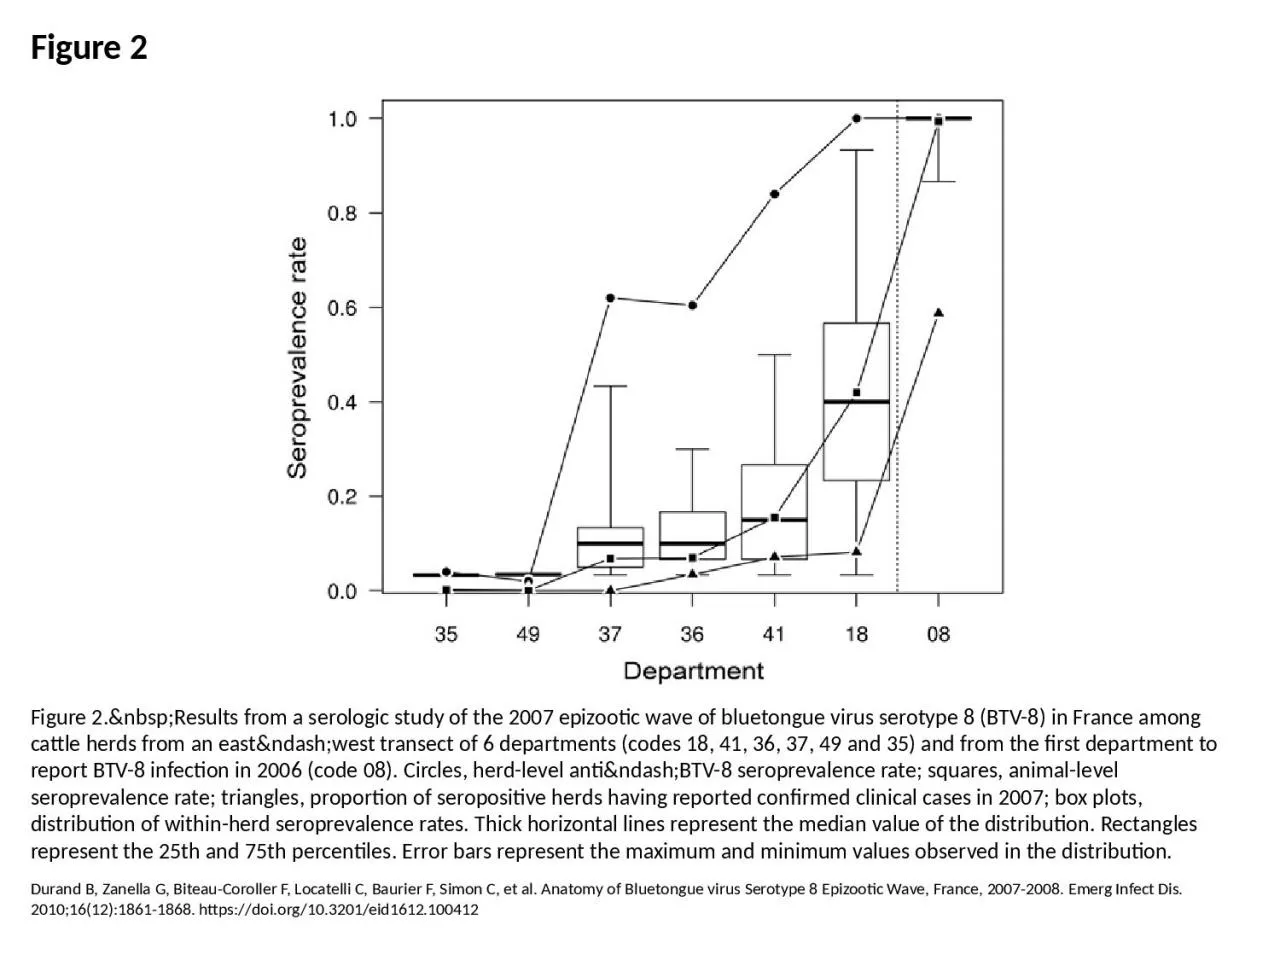
1. Figure 2Figure 2. Results from a serologic study of the 2007 epizootic wave of bluetongue virus serotype 8 (BTV-8) in France among cattle herds from an east–west transect of 6 departments (codes 18, 41, 36, 37, 49 and 35) and from the first department to report BTV-8 infection in 2006 (code 08). Circles, herd-level anti–BTV-8 seroprevalence rate; squares, animal-level seroprevalence rate; triangles, proportion of seropositive herds having reported confirmed clinical cases in 2007; box plots, distribution of within-herd seroprevalence rates. Thick horizontal lines represent the median value of the distribution. Rectangles represent the 25th and 75th percentiles. Error bars represent the maximum and minimum values observed in the distribution.Durand B, Zanella G, Biteau-Coroller F, Locatelli C, Baurier F, Simon C, et al. Anatomy of Bluetongue virus Serotype 8 Epizootic Wave, France, 2007-2008. Emerg Infect Dis. 2010;16(12):1861-1868. https://doi.org/10.3201/eid1612.100412