
recognise the physical shape of settlements and to be able to explain why they look like that To practice using OS maps Settlement Patterns Settlement Patterns Dispersed Linear Nucleated ID: 783912
Download The PPT/PDF document "Objective: To be able to" is the property of its rightful owner. Permission is granted to download and print the materials on this web site for personal, non-commercial use only, and to display it on your personal computer provided you do not modify the materials and that you retain all copyright notices contained in the materials. By downloading content from our website, you accept the terms of this agreement.


Slide1
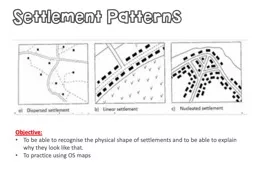
Objective: To be able to recognise the physical shape of settlements and to be able to explain why they look like that. To practice using OS maps
Settlement Patterns
Slide2Settlement Patterns
Dispersed
Linear
Nucleated
What would influence the development of these settlement patterns?
Slide3Nucleated, Linear or Dispersed?
Why?
Slide4Nucleated, Linear or Dispersed?
Why?
Slide5Nucleated, Linear or Dispearsed?
Why?
Slide6Nucleated, Linear or Dispersed?
Why?
Slide7Nucleated, Linear or Dispersed?
Why?
Slide8Nucleated, Linear or Dispersed?
Why?
Slide9Nucleated, Linear or Dispersed?
Why?
Slide10Ordnance survey
Ordnance Survey
(OS) is Britain’s national mapping agency.
They produce most of the commonly used maps and map data for the British Isles.
What map features tell you what the land is like?
What map features would help you navigate?
1km
N
Scale 1:50 000
Slide11Ordnance survey
OS maps contain:
1km
N
Scale 1:50 000
symbols and place names
contour lines and spot heights
a scale
grid references and grid lines
orientation
Slide12Settlement Patterns and Hierarchy
Using your OS map find as many examples of settlement patterns as you can and fill in the table below.
Settlement Pattern
Grid Reference
Village Name
Reason
Use both the paper and digital versions of the OS maps
Online login:
deanna.thompson@bishouston.org
Geography
Choose a location in the UK you would like to look at (it is better if it is rural).
Slide13Map skills using Burnham on Sea MapInitial general observations of the map
Slide14Generally flat land
Main settlement Steep hill
Mud
Extensive drainage network
A lot of farm land…could be allowed to flood
Very straight/ linear road network
M5-major road
Slide15Questions using Burhnam map Name a linear, dispersed and nucleated settlement (3)What is the 4 figure grid reference of Pawlett (1)What is the 4 figure grid reference of Alston Sutton (1)Where would you place the following settlements on the settlement hierarchy and why? Burhnam
(1+1)Mark (1+1)Vole Farm (1+1)Extension:5. Describe the distribution of settlements on the map (4)6. Explain why this distribution may have occured (4)
Slide16Questions using Exeter map Name a linear, dispersed and nucleated settlement (3)What is the 4 figure grid reference of Broadclyst (1)What is the 4 figure grid reference of Lympstone (1)Where would you place the following settlements on the settlement hierarchy and why (use evidence from the map? Exeter (1+2)
Exmouth (1+2)Otterton (1+2)Extension:5. Describe the distribution of settlements on the map (4)6. Explain why this distribution may have occured (4)
Slide17Questions using Purbeck map Name a linear, dispersed and nucleated settlement (3)What is the 4 figure grid reference of Shipton Gorge (1)What is the 4 figure grid reference of Uplolders(1)Where would you place the following settlements on the settlement hierarchy and why (use evidence from the map? Dorchester (1+2)
Shipton Gorge (1+2)Westfleet farm (1+2)Extension:5. Describe the distribution of settlements on the map (4)6. Explain why this distribution may have occured (4)
Slide18Questions using Ben Nevis mapName a linear, dispersed and nucleated settlement (3)What is the 4 figure grid reference of Roybridge (1)What is the 4 figure grid reference of Tullock (1)Where would you place the following settlements on the settlement hierarchy and why? Fort William (1+2)
Spearn Bridge(1+2)Annat FarmExtension:5. Describe the distribution of settlements on the map (4)6. Explain why this distribution may have occured
(4)
Slide19Rural Settlement- Tsoelike Valley, Lesotho
Task: Read page 47-48 of textbook. Answer al questions in box 5 in detail Extension: Use this link to play with the activities based on this case study: https://quizlet.com/106861926/settlement-in-the-tsolike-valley-lesotho-ledc-flash-cards/
What factors have influenced the settlement pattern in this area?