
Domain The x values of the ordered pair Range The y values of the ordered pair 35 Introduction to Functions x y 1 3 2 5 4 6 1 4 3 3 x y 4 2 3 8 6 1 1 9 5 6 x ID: 1045784
Download Presentation The PPT/PDF document "Defn: A relation is a set of ordered p..." is the property of its rightful owner. Permission is granted to download and print the materials on this web site for personal, non-commercial use only, and to display it on your personal computer provided you do not modify the materials and that you retain all copyright notices contained in the materials. By downloading content from our website, you accept the terms of this agreement.

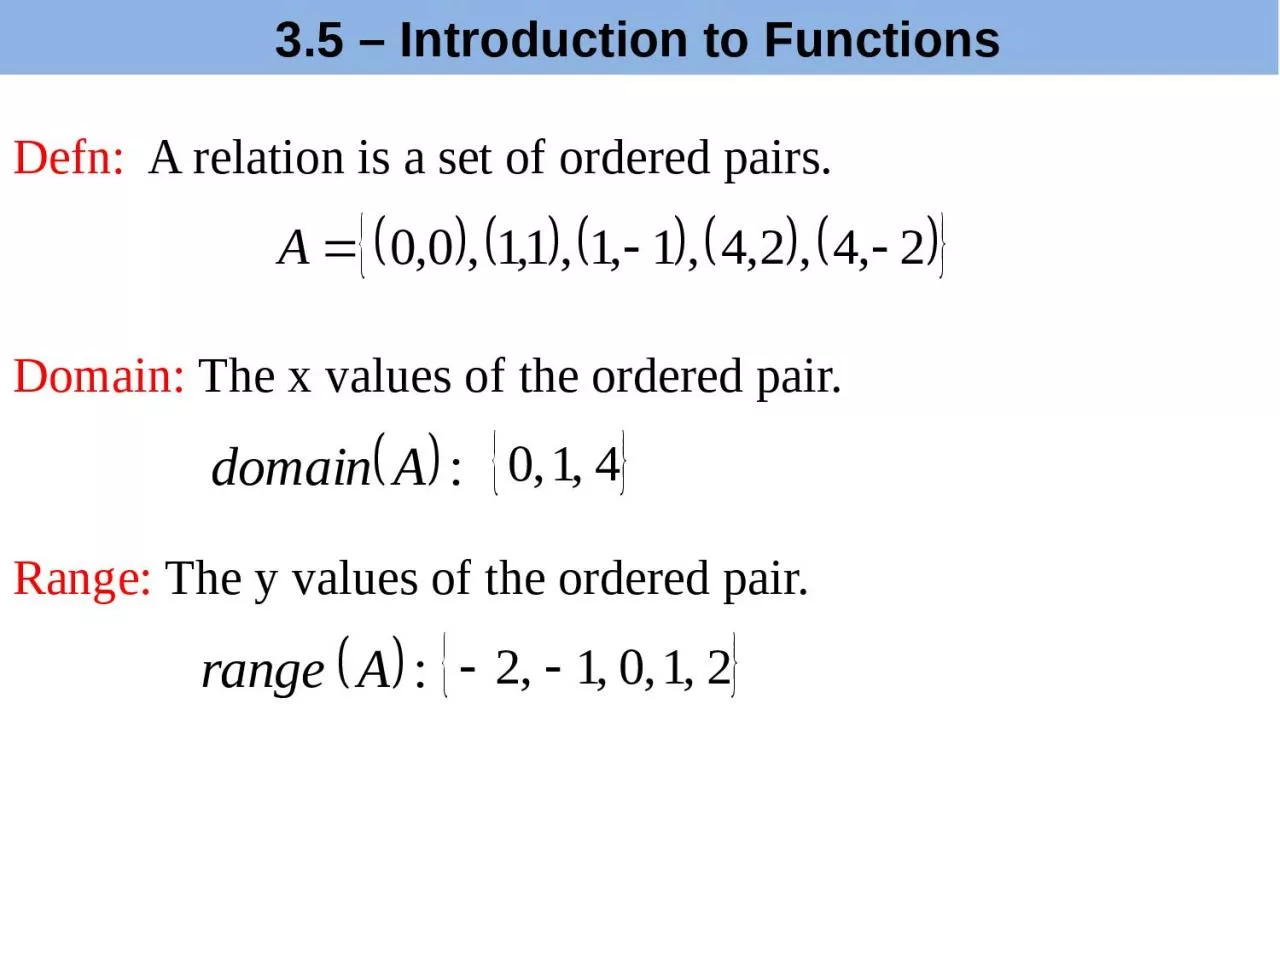
1. Defn: A relation is a set of ordered pairs.Domain: The x values of the ordered pair.Range: The y values of the ordered pair.3.5 – Introduction to Functions
2. xy1325-461433xy42-3861-1956xy235738-2-587State the domain and range of each relation.3.5 – Introduction to Functions
3. Defn: A function is a relation where every x value has one and only one value of y assigned to it.xy1325-461433xy42-3861-1956xy235738-2-587functionnot a functionfunctionState whether or not the following relations could be a function or not.3.5 – Introduction to Functions
4. Functions and Equations.xy0-357-2-74533xy24-24-41639-39xy111-1424-200functionfunctionnot a functionState whether or not the following equations are functions or not.3.5 – Introduction to Functions
5. Vertical Line TestGraphs can be used to determine if a relation is a function.If a vertical line can be drawn so that it intersects a graph of an equation more than once, then the equation is not a function.3.5 – Introduction to Functions
6. xyThe Vertical Line Testxy0-357-2-74533function3.5 – Introduction to Functions
7. xyxy24-24-41639-39The Vertical Line Testfunction3.5 – Introduction to Functions
8. xyxy111-1424-200The Vertical Line Testnot a function3.5 – Introduction to Functions
9. Find the domain and range of the function graphed to the right. Use interval notation.xyDomain:DomainRange:Range[–3, 4][–4, 2]Domain and Range from Graphs3.5 – Introduction to Functions
10. Find the domain and range of the function graphed to the right. Use interval notation.xyDomain:DomainRange:Range(– , )[– 2, )Domain and Range from Graphs3.5 – Introduction to Functions
11. Function NotationShorthand for stating that an equation is a function.Defines the independent variable (usually x) and the dependent variable (usually y).3.6 – Function Notation
12. Function notation also defines the value of x that is to be use to calculate the corresponding value of y.f(x) = 4x – 1find f(2).f(2) = 4(2) – 1f(2) = 8 – 1f(2) = 7(2, 7)g(x) = x2 – 2xfind g(–3). g(–3) = (-3)2 – 2(-3)g(–3) = 9 + 6 g(–3) = 15(–3, 15)find f(3).3.6 – Function Notation
13. Given the graph of the following function, find each function value by inspecting the graph.f(5) =7xyf(x)f(4) =3f(5) =1f(6) =6● ●●●3.6 – Function Notation
14. 3.6 – Function Notation