
Wang H Hogan CA Miller JA Sahoo MK Huang C Mfuh KO et al Performance of Nucleic Acid Amplification Tests for Detection of Severe Acute Respiratory Syndrome Coronavirus 2 in Prospectively Pooled Specimens Emerg Infect Dis 202127192103 httpsdoiorg103201eid2701203379 ID: 1006475
Download Presentation The PPT/PDF document "Figure 2 Figure 2. Performance of nuclei..." is the property of its rightful owner. Permission is granted to download and print the materials on this web site for personal, non-commercial use only, and to display it on your personal computer provided you do not modify the materials and that you retain all copyright notices contained in the materials. By downloading content from our website, you accept the terms of this agreement.


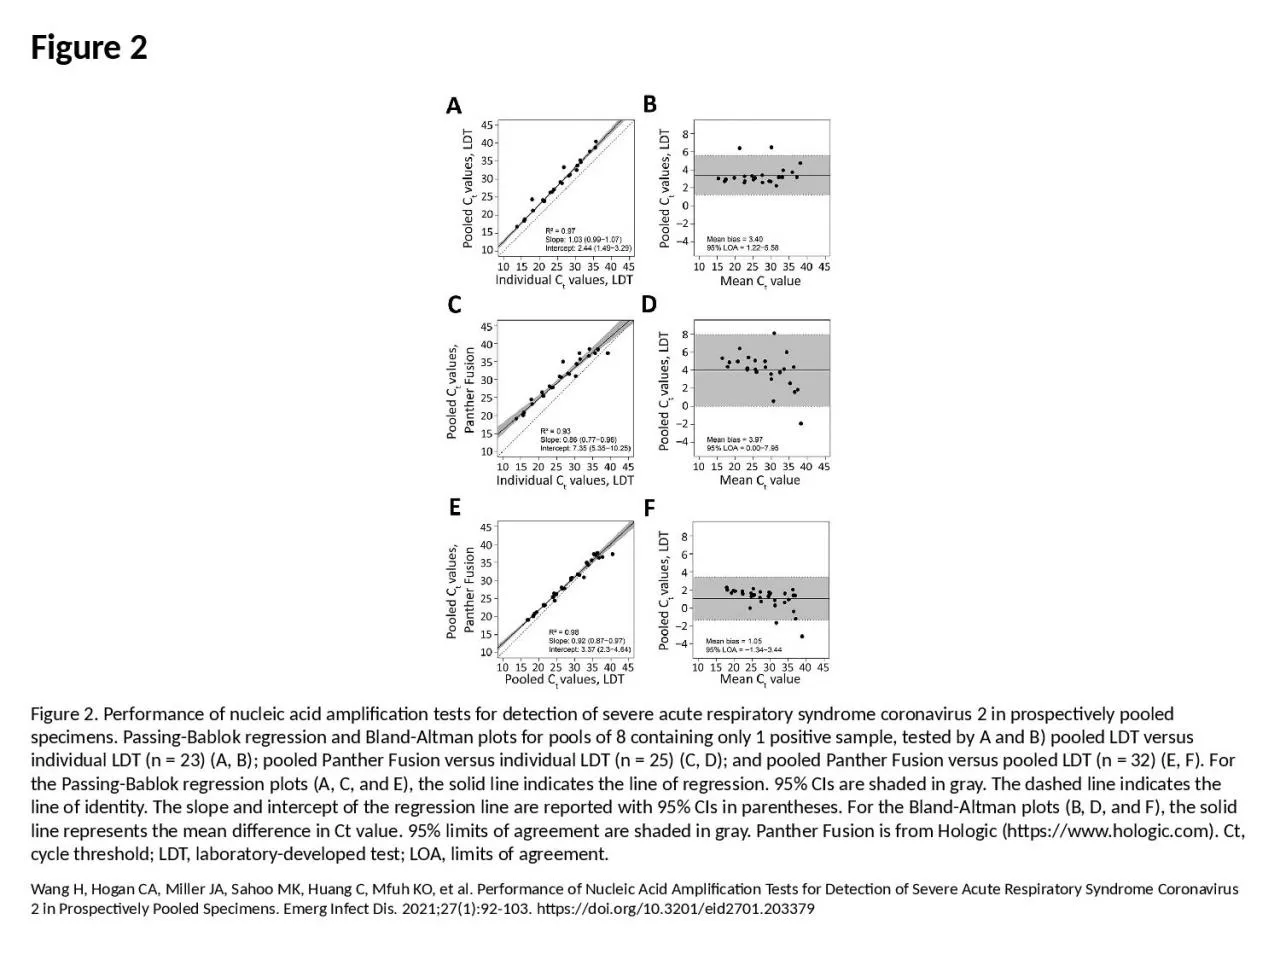
1. Figure 2Figure 2. Performance of nucleic acid amplification tests for detection of severe acute respiratory syndrome coronavirus 2 in prospectively pooled specimens. Passing-Bablok regression and Bland-Altman plots for pools of 8 containing only 1 positive sample, tested by A and B) pooled LDT versus individual LDT (n = 23) (A, B); pooled Panther Fusion versus individual LDT (n = 25) (C, D); and pooled Panther Fusion versus pooled LDT (n = 32) (E, F). For the Passing-Bablok regression plots (A, C, and E), the solid line indicates the line of regression. 95% CIs are shaded in gray. The dashed line indicates the line of identity. The slope and intercept of the regression line are reported with 95% CIs in parentheses. For the Bland-Altman plots (B, D, and F), the solid line represents the mean difference in Ct value. 95% limits of agreement are shaded in gray. Panther Fusion is from Hologic (https://www.hologic.com). Ct, cycle threshold; LDT, laboratory-developed test; LOA, limits of agreement.Wang H, Hogan CA, Miller JA, Sahoo MK, Huang C, Mfuh KO, et al. Performance of Nucleic Acid Amplification Tests for Detection of Severe Acute Respiratory Syndrome Coronavirus 2 in Prospectively Pooled Specimens. Emerg Infect Dis. 2021;27(1):92-103. https://doi.org/10.3201/eid2701.203379