
Bar Chart Click on the Insert tab Select cells C1D7 your Frequency Distribution Choose Recommended Charts or Insert Column or Bar Chart Bar Chart Select the basic Clustered Column graph but note the other possibilities for future reference ID: 912264
Download Presentation The PPT/PDF document "Bar Chart The data (here using the text�..." is the property of its rightful owner. Permission is granted to download and print the materials on this web site for personal, non-commercial use only, and to display it on your personal computer provided you do not modify the materials and that you retain all copyright notices contained in the materials. By downloading content from our website, you accept the terms of this agreement.


Slide1
Bar Chart
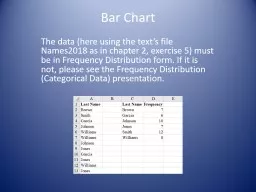
The data (here using the text’s file Names2018 as in chapter 2, exercise 5) must be in Frequency Distribution form. If it is not, please see the Frequency Distribution (Categorical Data) presentation.
Slide2Bar Chart
Click on the Insert tab
Select cells C1:D7 (your Frequency Distribution)
Choose Recommended Charts or Insert Column or
Bar Chart
Slide3Bar Chart
Select the basic Clustered Column graph (but note the other possibilities for future reference)
Slide4Bar Chart
You will get a pretty basic bar graph.
Use Chart Design and Chart Tools to make your graph prettier and give it the appropriate labels.
Slide5Bar Chart