
in Jordan Stefania Di Giuseppe Economist RAP Team Marco Letta Economist RAP Team Food and Agriculture Organization of the United Nations FAO RIMAfaoorg Outline 1 Introduction 2 RIMA Resili ID: 854045
Download Pdf The PPT/PDF document "Resilience analysis" is the property of its rightful owner. Permission is granted to download and print the materials on this web site for personal, non-commercial use only, and to display it on your personal computer provided you do not modify the materials and that you retain all copyright notices contained in the materials. By downloading content from our website, you accept the terms of this agreement.


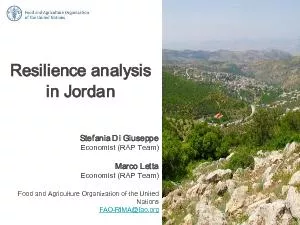
1 Resilience analysis in Jordan Stefania
Resilience analysis in Jordan Stefania Di Giuseppe Economist (RAP Team) Marco Letta Economist (RAP Team) Food and Agriculture Organization of the United Nations FAO - RIMA@fao.org Outline 1. Introduction 2. RIMA: Resilience to Food Insecurity - Why RIMA? - What is RIMA? - How is it
2 implemented? 3. Dataset and RIMA indicat
implemented? 3. Dataset and RIMA indicators 4. Resilience analysis: baseline results 5. Resilience analysis: heterogeneity 6. RCI and shocks 7. Next steps: policy links and potential extensions Outline 1. Introduction 1. Introduction The Jordanian Context â Despite being an upper mi
3 ddle - income country, Jordan maintains
ddle - income country, Jordan maintains pockets of food insecurity , especially in communities that with protracted economic hosting refugees. It is home to nearly 700,000 UN - registered Syrian refugees . Jordan is one of the worldâs four most water - deficit countries . Due to
4 scarce water supplies, recurrent droug
scarce water supplies, recurrent drought, urbanization and desertification, agricultural production is insufficient, making Jordan a net importer of foodâ (WFP, 2017) .â Prevalence of Undernourishment ( PoU ) increased by almost 57% from 2009 to 2012 (WB data). Despite the
5 value added of Agriculture accounts
value added of Agriculture accounts only for less than 4 % of Jordanian GDP (WB data),in some rural areas it is still - in its economical and social dimensions - a fundamental sector of the economy (FAO,2012). 1. Introduction Resilience - Resilience is, nowadays, one of the
6 key words in the policy debate on devel
key words in the policy debate on development economics. Measuring resilience and how it varies over time is extremely significant for policy makers and people living in risk - prone environments. - A promising concept for understanding how the households cope with shocks and s
7 tressors - Identification of how the com
tressors - Identification of how the combined effect of climate changes, economic forces and social conditions has increased the frequency and severity of risk exposure among vulnerable populations . 2. RIMA: Resilience to Food Insecurity The intervention Framework: ⢠FAO Stra
8 tegic Objective 5: âIncrease the Resil
tegic Objective 5: âIncrease the Resilience of Livelihoods from Disastersâ ⢠The Resilience Index Measurement and Analysis (RIMA) is a model used to measure resilience capacity and effectiveness of resilience - oriented policies in the high profile countries ⢠RIMA has been
9 applied in over 10 countries Aims: â¢
applied in over 10 countries Aims: ⢠Analyse the resilience capacity of Jordan households as well as to assess their ability to cope with idiosyncratic and covariate shocks ⢠Enhance Jordanâs capabilities in dealing with its humanitarian and development needs. 2. RIMA 2. RI
10 MA ⢠Resilience Capacity Index (RCI)")
MA ⢠Resilience Capacity Index (RCI) estimated through the FAO - RIMA approach ⢠Resilience pillars estimated through FAO - RIMA: - Access to Basic Services (ABS) - Assets (AST) - Social Safety Nets (SSN) - Adaptive Capacity (AC) ⢠Observed variables , employed to estimate t
11 he pillars (e.g. wealth index, average
he pillars (e.g. wealth index, average education, access to improved sanitation, Tropical Livestock Units - TLUs, etc.) ⢠Food security indicators (food consumption, Food Consumption Score â FCS, etc.) Methodology 3. Data and descriptive statistics 3. Data and RIMA indicator
12 s Dataset ⢠Jordan 2013 Household Exp
s Dataset ⢠Jordan 2013 Household Expenditure and Income Survey (HEIS) by the Jordan Department of statistics ( DoS ) ⢠Partial sample : 7898 households ⢠Representative at the national, governorate, district and sub - district level (sample weights) RIMA indicators Pillar
13 Variable Access to Basic Services (ABS)")
Variable Access to Basic Services (ABS) Service closeness ( education,health,security ) Service satisfaction ( transports , water, health ) Daily water supply Stable access to water Public water Assets (AST) Wealth index R esidential buildings for household use Animal index Land lot
14 s T ools and equipments for production
s T ools and equipments for production Social Safety Nets (SSN) Subsidies from National Aid Fund (NAF) Public transfers (value) Private transfers (value) Adaptive Capacity (AC) Average years of education Education level of the Household Head Dependency Ratio (inverse) Participati
15 on index Food Security Indicators (FS) F
F")
on index Food Security Indicators (FS) Food consumption (pc) Food Consumption Score (FCS) 4. Resilience analysis: baseline results Which are the most important pillars ? Assets (AST) and in particular Adaptive Capacity ( AC ) are highly linked to Resilience Capacity, and they s
16 trongly contribute to household capaci
trongly contribute to household capacity to absorbe , adapt to and recover from shocks . Access to Basic Services (ABS) appears to be less relevant, while the role of Social Safety Nets (SSN) is negligible. Investments should focus on improving these pillars that can boost r
17 esilience capacity. 4. Resilience analys
esilience capacity. 4. Resilience analysis: baseline results Average RCI Value (0 - 100): 60.059 ⦠And the most important variables ? Previous findings: ⢠â Food insecurity is linked to a large extent to the education level of the head of household. Households whose heads are
18 illiterate or barely literate are more
illiterate or barely literate are more at risk of food insecurity and vulnerabilityâ (The State of Food Security in Jordan 2013 - 2014, DoS ) 4. Resilience analysis: baseline results Two types of intervention: 1) Enhance the role of Social Safety Nets (SSN) and Assets (AST) is ke
19 y for an overall increase in resilience
y for an overall increase in resilience 2) Boost Access to Basic Services and Adaptive Capacity (AC) (e.g. access to water, education, income diversification) in the least resilient areas/categories is crucial to reduce inequality in resilience capacity 5. Resilience analysis: het
20 erogeneity 5. Resilience analysis: heter
erogeneity 5. Resilience analysis: heterogeneity RCI heterogeneity Consistency with Jordan DoS findings 5. Resilience analysis: heterogeneity Share of components ( pillars ): gender 5. Resilience analysis: heterogeneity Share of components ( pillars ): governorates 5. Resilience
21 analysis: heterogeneity Jordanian vs Non
analysis: heterogeneity Jordanian vs Non - Jordanian households 5. Resilience analysis: heterogeneity We detect heterogeneity not only in between resilience capacity , but also in the components of the RCI between Jordanian and Non - Jordanian households in most governorates .
22 6. RCI and shocks 6. RCI and shocks RCI
6. RCI and shocks 6. RCI and shocks RCI and shocks: OLS results As expected , idiosyncratic (food and illness ) shocks and covariate ones (i.e. droughts , especially if prolonged over time) significantly descrease household resilience capacity . In particular , an OLS regress
23 ion shows the following shocks have a
ion shows the following shocks have a negative and statistically significant impact ( at the 1 percent level ) on resilience capacity : Idiosyncratic shocks : food shocks (i.e. eating no food for a whole day) and illness of a household member . Covariate shocks : Agricul
24 tural Stress Index (ASI) Consistently ,
Consistently
,")
tural Stress Index (ASI) Consistently , the Normalized Difference Vegetation Index (NDVI) has a positive and significant impact. F urthermore , covariate shocks have an even bigger impact when they are prolonged over time. 7. Next steps: policy links and potential extensions C
25 urrent status: Stage 2 7. Next steps St
urrent status: Stage 2 7. Next steps Stage 1 Preliminary RIMA analysis Stage 2 Incorporation of policy feebacks Stage 3 RIMA and Policy - making ⢠Need to tailor RIMA over key policy research questions ⢠Compare the core findings emerged with the main socio - economic po
26 licies currently implemented in Jordan â
licies currently implemented in Jordan ⢠Extensions : Exploration of resilience dynamics over time and the causal relationship with shocks through the use of longitudinal data THANK YOU! Contact us: Stefania.Digiuseppe@fao.org Marco.Letta@fao.org ⦠and sign up to our newslet