
Is the Frequency and Magnitude of Extreme Hydrological Events Changing in Southern New York State Adao Matonse 1 Allan Frei 2 David Lounsbury 1 Donald Pierson 1 Mark Zion 1 and Elliot Schneiderman ID: 422278
Download Presentation The PPT/PDF document "Hydrological Impact of Hurricane Irene a..." is the property of its rightful owner. Permission is granted to download and print the materials on this web site for personal, non-commercial use only, and to display it on your personal computer provided you do not modify the materials and that you retain all copyright notices contained in the materials. By downloading content from our website, you accept the terms of this agreement.


Slide1
Hydrological Impact of Hurricane Irene and Tropical Storm Lee in Historical Context:
Is the Frequency and Magnitude of Extreme Hydrological Events Changing in Southern New York State?
Adao Matonse1, Allan Frei2, David Lounsbury1 Donald Pierson1, Mark Zion1, and Elliot Schneiderman1
1
New York City Environmental
Protection
2
The City University of New York – Hunter
CollegeSlide2
Presentation OutlineIntroductionStudy AreaData and Methods
How Unique were Irene and Lee?The Frequency of Extreme Events in the Study RegionThe Magnitude of Extreme EventsImplications for HydrologyConclusionsSlide3
Tannersville, photo by Sean Mahoneyhttp://www.wnyc.org/blogs/wnyc-newsblog/2011/aug/31/focus-shifts-people-stranded-catskills-flood-waters-recede
/Main Street,
Margaretvillehttp://www.buzzfeed.com/mjs538/frightening-hurricane-irene-destruction-photosWindhamhttp://www.buzzfeed.com/mjs538/frightening-hurricane-irene-destruction-photos
New Windsor
http://en.wikipedia.org/wiki/File:Forge_Hill_Road_bridge_washout_after_Hurricane_Irene,_New_Windsor,_NY.jpgIrene in the CatskillsSlide4
Irene in the Catskills: Schoharie Creek,
PrattsvillePhoto Immediately after Irene, Sep 1, 2011, photo by Danyell Davis, NYCDEPSlide5
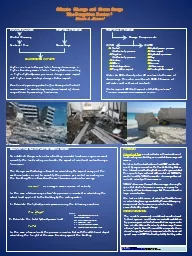
Changes over Time in Frequency of Extreme Events
Warner Creek, Near Stony Clove, Catskills, May 2012Headcut incised during storms of 2011 exposing glacial till that has probably not been exposed in 15-20K yrs.
Course sediment is being recruited from upstream, but channel bed now at a lower base level than prior to Irene. These sorts of fluvial geomorphological changes are related to the frequency and magnitude of extreme events, as well as human impact on channel conditions. Human impacts up- or down-stream can also play a role.Photos and geomorphological information from Danyell Davis, NYCDEPSlide6
NYSERDA funded study :Hydrology, Vulnerability and Adaptation Implications of Hurricane Irene and Tropical Storm Lee:Case Study of the Mid-Hudson Valley and Greater Catskills RegionsHydrological study (this talk)
Impacts, Costs, and vulnerabilitiesAdaptation and Needs AssessmentSlide7
Collaborators NYCDEP: Don Pierson, Elliot Schneiderman, Mark Zion, Soni Pradhanang, Don
Kent, Rajith Mukundan, Nihar Samal, Yongtai Hwang, David Lounsbury, Danyell Davis, Terry Spies, Dom Thongs, Jim Porter NYSERDA funded project on Hurricane Irene and Tropical Storm Lee: William Solecki, Simon Gruber, Robin Leichenko, Lesley Patrick,
Susan Sofranko, Michael BradySlide8
Map by David Lounsbury - NYCDEPStudy Area and Station LocationsSlide9
Data hourly-radar-based gridded daily 4km precipitation (NRCC) (DeGaetano and Wilks 2009)
12 precipitation gauge records (NCDC)>= 30 yrs continuous records 9 stream gauge records (USGS) >= 30 yrs continuous records, unregulated
Methods Parametric (standard recurrence interval analysis) non-parametric (define “extreme” as >=95th Percentile Event) Seasonal (warm season = 1 June through 31 October) Antecedent conditions (30 day precipitation prior to an extreme event) Proximity in space and time of two extreme events
Data and MethodsSlide10
4-Day Precipitation Contours and Recurrence Intervals
Hurricane Irene (26-29 Aug., 2011) Tropical Storm Lee (5-8 Sep. 2011)Maps by David
Lounsbury, NYCDEPSlide11
Precipitation-Difference Contours and Stations
Irene minus Lee
Irene > LeeLee > IreneMap by David Lounsbury, NYCDEPSlide12
Irene and Lee in context of historical extreme precipitation eventsThe events of Fall 2011 were unprecedented in this region due to a combination ofthe magnitude of precipitation during Irene and Lee
the proximity of these two eventsAntecedent conditions and subsequent precipitationThe occurrence of two events of comparable magnitude to Irene and Lee within only 11 days of each other is highly unusual in this region30-day total precipitation prior to Irene was large compared to other extreme eventsIf one considers all 60-day precipitation totals on record, the fall of 2011 stands out as an unprecedented event.Slide13
Values are ranges across all stations.
Percentage of Seasons During WhichExtreme 4-day Precipitation EventsOccur Within 12 days of each other(prior to Irene and Lee)Slide14
Frequency of Extreme Events:
Non-Parametric AnalysisExample from one station Ellenville 4-day Precipitation
Cold SeasonWarm Season
5 highest values
95 %tile valueSlide15
Non-parametric data analysis
Extreme Events(All Events >= 95 percentile) Daily Precipitation Daily Streamflow
Unimodal
(peak in Fall)Bimodal (peaks in Spring & Fall)
warm
season
warm
seasonSlide16
Number of 95%tile values per year
Example from Ellenville 4-day Precipitation Cold Season
max smooth value
Smooth (11-yr mean)
Warm Season
Changes over Time in Frequency of Extreme Events: Slide17
Cold Season
Warm Season
Smooth (11-yr mean)max smooth value
1985, 2006
Changes over Time in Frequency of Extreme Events
Number of 95%tile 4-d precipitation values per year all stationsSlide18
Smooth (11-yr mean)
max smooth value
1985, 2006
Cold Season
Warm Season
Changes over Time in Frequency of Extreme Events
Number of 95%tile daily streamflow values per year all stationsSlide19
Cold season
Warm season
4-day Precipitation1-day StreamflowNumber of 95%tile values per year: all stationsSlide20
Frequency analysis
Daily Precipitation
Daily
Streamflow
Warm > Cold
(all events)Warm < Cold(for low return interval only)Slide21
Changes over Time in Magnitude of Flood Flows
Each color is a different overlapping 30-year period starting 10 years apart
One example using multiple 30-year periods annual peak flow Slide22
NOAA Climate Extremes Index (CEI) (= arithmetic average of six indicators)http://www.ncdc.noaa.gov/extremes/cei/graph/ne/cei/03-05 (accessed Sep 9, 2013)
Other studies on extreme climatic events (EE)Showing increasing percentage CEI in recent yearsSlide23
… and projecting an increasing intensity of EE (Kunkel et al 2013, GRL)Slide24
Intergovernmental Panel on Climate Change
Special Reports: SREX (2012)Climate Extreme (extreme weather or climate event):
The occurrence of a value of a weather or climate variable above (or below) a threshold value near the upper (or lower) ends of the range of observed values of the variable. Slide25
Intergovernmental Panel on Climate ChangeSpecial Reports: SREX (2012)
Projected decrease in recurrence intervals for daily precipitation equal to historical 20-year recurrence during the late 20th Century. Different colors = different scenariosSlide26
Monier and Gao, 2013Slide27
Of changing frequency and magnitude of extreme eventsBulletin 17B recommends 25-year record for flood frequency analysisBased on assumption of stationarity of climate
Results show this assumption is questionable due to:TrendsHydrologic regime shifts (mean, variance)Need for a “new normal”
Implications for Hydrology
Shifts in mean
Winter-flow USGS-1350000, 1929-2010Slide28
Not new in water resources planning and managementIs usually considered when supported by a strong scientific basis (Hirsch 2011)Basins urbanization lead to change in FF distributions Groundwater depletion affecting baseflow and low flow regimeAnd these are not related to climate change
Nonstationarity
or “changing normal”Slide29
Can be reflected by various changes such as in:Regional air temperature Water demand as a function of temperaturePatterns of rain and snowTiming of snowmelt
Frequency and magnitude of hydrologic extreme eventsLand use/coverHow does NYC address this issue ?
NonstationaritySlide30
Simulates water supply by routing water between reservoirs, while accounting for various rules and competitive goalsSupports water supply operations and planning needsHigh flexibility, improved inflow forecast
NYC
Operations
Support ToolSlide31
The events of Fall 2011 were unprecedented in this region due to a combination of:the magnitude of precipitation in each eventthe proximity in space and time of the two events
antecedent and subsequent precipitationAs a result, Fall 2011 had the highest 60-day precipitation total on record in this region
ConclusionsSlide32
The frequencies of extreme warm season hydrologic events have risen to their highest values on record during the last two decadesWhile this study does not address potential for these patterns to continue into the future, these results are consistent with other recent empirical studies, and with 21
st century projections based on climate modelsConclusions (cont’d)Slide33
Nonstationarity is a concern in hydrology and needs to be addressedIt need to be accounted for in water resources planning and management
The NYC OST is a good example for a flexible management tool to face today’s challengesConclusions (cont’d)Slide34
Deep gorge created in Frost Valley (Ulster County Route 47) when floods after Hurricane Irene blew out a culvert below the road in Oliverea, NY. http://en.wikipedia.org/wiki/Effects_of_Hurricane_Irene_in_New_York#Orange_County
Thank You!Slide35
Cold season
Warm season
30-dayPrecipitation30-dayStreamflowNumber of 95%tile values per year: all stationsSlide36
Cold season
Warm season
60-dayPrecipitation60-dayStreamflowNumber of 95%tile values per year: all stationsSlide37
Ashokan reservoir during a turbidity event. Turbid water moving from West to East basins (2006)Extreme Events Can Affect Water Quality