
J Bingham and M Alma Rodriguez The University of Texas MD Anderson Cancer Center Houston Texas BACKGROUND At the University of Texas MD Anderson Cancer Center an Ad Hoc Quality Committee was appointed by the Executive Committee of the Medical Staff ECMS to create a quality plan acro ID: 909490
Download Presentation The PPT/PDF document "Engaging a Medical Staff to Achieve High..." is the property of its rightful owner. Permission is granted to download and print the materials on this web site for personal, non-commercial use only, and to display it on your personal computer provided you do not modify the materials and that you retain all copyright notices contained in the materials. By downloading content from our website, you accept the terms of this agreement.


Slide1
Engaging a Medical Staff to Achieve Higher Value in Cancer Care
J. Bingham and M. Alma RodriguezThe University of Texas MD Anderson Cancer Center, Houston, Texas
BACKGROUND
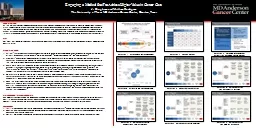
At the University of Texas MD Anderson Cancer Center, an Ad Hoc Quality Committee was appointed by the Executive Committee of the Medical Staff (ECMS) to create a quality plan across the cancer care continuum. The committee used the six IOM Aims for Improvement from the Crossing the Quality Chasm Report (Safe; Timely; Efficient; Effective; Equitable; Patient-Centered) as dimensions of quality across all seven phases of cancer care delivery-Access; Prevention and Screening; Diagnosis; Treatment; Surveillance; Survivorship and End of Life. A model was created that integrates W. Edwards Deming’s
Organization as a System
and Michael Porter’s
Value Equation as the framework for the quality plan. (Diagram 1)AIM: Our goal was to develop a proactive strategy, specific to our practice, that promotes quality oversight and improvement through a medical practice quality plan.METHODS/DATAPatient’s Satisfaction (via Press Ganey Survey) was evaluated to help determine improvement priorities from a patient perspective. The top three drivers of Out-patient Satisfaction were: “Wait Time to See MD”; “Information about Delays”; and “Emotional Needs.” Providers’ perceptions of improvement priorities were assessed through a matrix that juxtaposed the IOM Aims and the Phases of Care. (Diagram 2). Using Survey Monkey, 550 members of the Medical Staff (including Mid-Level Providers) were surveyed (220 responses) as to the two most important IOM Aims for each phase of care. (Diagram 3).There were no statistical differences between the perceptions of physicians vs Mid-Level providers in any phase of care. Four phases (Access, Diagnosis, Treatment, and End of Life), were chosen as Strategic Focus Areas. The priorities for improvement were “Timeliness” and “Efficiency” for “Access” and “Diagnosis”, “Effectiveness” and “Safety” for “Treatment” and “Patient Centeredness” for End of Life. Supporting diagram 4 illustrates the four focus areas and the prioritized IOM Aims.To measure the applicability of the results to patient volumes, a Bubble Char of patient encounters across the continuum of care was used (Diagram 4). This analysis illustrated that the highest touch points for patients were: Access (115,000 patients); Diagnosis (12+ million tests and encounters); and Treatment (7+ million encounters).Once the priority focus areas across the continuum were identified, a Driver Diagram Framework was created to strategically define the necessary actions in each strategic focus area. The Driver Diagram Framework includes: Phase of Care; IOM Aim; Focus Area; Actions; Metrics; and Gaps/Barriers. (Diagram 5-9) For example, the “Access Driver Diagram” defined key “Actions” to be “Timely access to appointments by consistent use of established Medical Acceptance Criteria within each center” and “Efficient template management to facilitate new patient appointments.”GOVERNANCE/IMPLEMENTATIONThe medical staff quality plan was approved by the ECMS and reviewed for input/support through the Center Medical Directors (33 physicians) Quality Officers (43 physicians) Clinical Chairs (33 physicians) and Division Heads (9 physicians) and the institution’s Senior Management Committee and President. The plan is now being implemented across the enterprise to include all 1400 physicians and trainees.REFERENCESInstitute of Medicine. Crossing the Quality Chasm: A new Health System for the 21st Century. Washington, DC: National Academy Press, 2001.Deming WE. The New Economics for Industry, Education, Government. Cambridge, MA: Massachusetts Institute of Technology, Center for Advanced Engineering Study, 1993.Porter, ME. Redefining Healthcare: Creating Value-Based Competition on Results. Boston, MA: Harvard Business Review Press, 2006.
Diagram 1: Framework for Improvement
Diagram 2: Survey Results
Diagram 3: Selected Improvement Priorities Based on Survey Results
Diagram 4: Priorities and Service Volumes
Diagram 5: Access Driver Diagram
Diagram 6: Driver Diagram
for Diagnostic Imaging
Diagram 7: Driver Diagram for
Laboratory and Pathology
Diagram 8: Driver Diagram for Treatment
Diagram 9: Driver Diagram
for End of Life Care