
The 2002 UHES and the 1996 UDHS used similar data collection processes and direct estimation techniques to produce infant mortality estimates The 2000 MICS employed a different methodology for both ID: 954841
Download Pdf The PPT/PDF document "Infant and Child Mortality dent reporti..." is the property of its rightful owner. Permission is granted to download and print the materials on this web site for personal, non-commercial use only, and to display it on your personal computer provided you do not modify the materials and that you retain all copyright notices contained in the materials. By downloading content from our website, you accept the terms of this agreement.


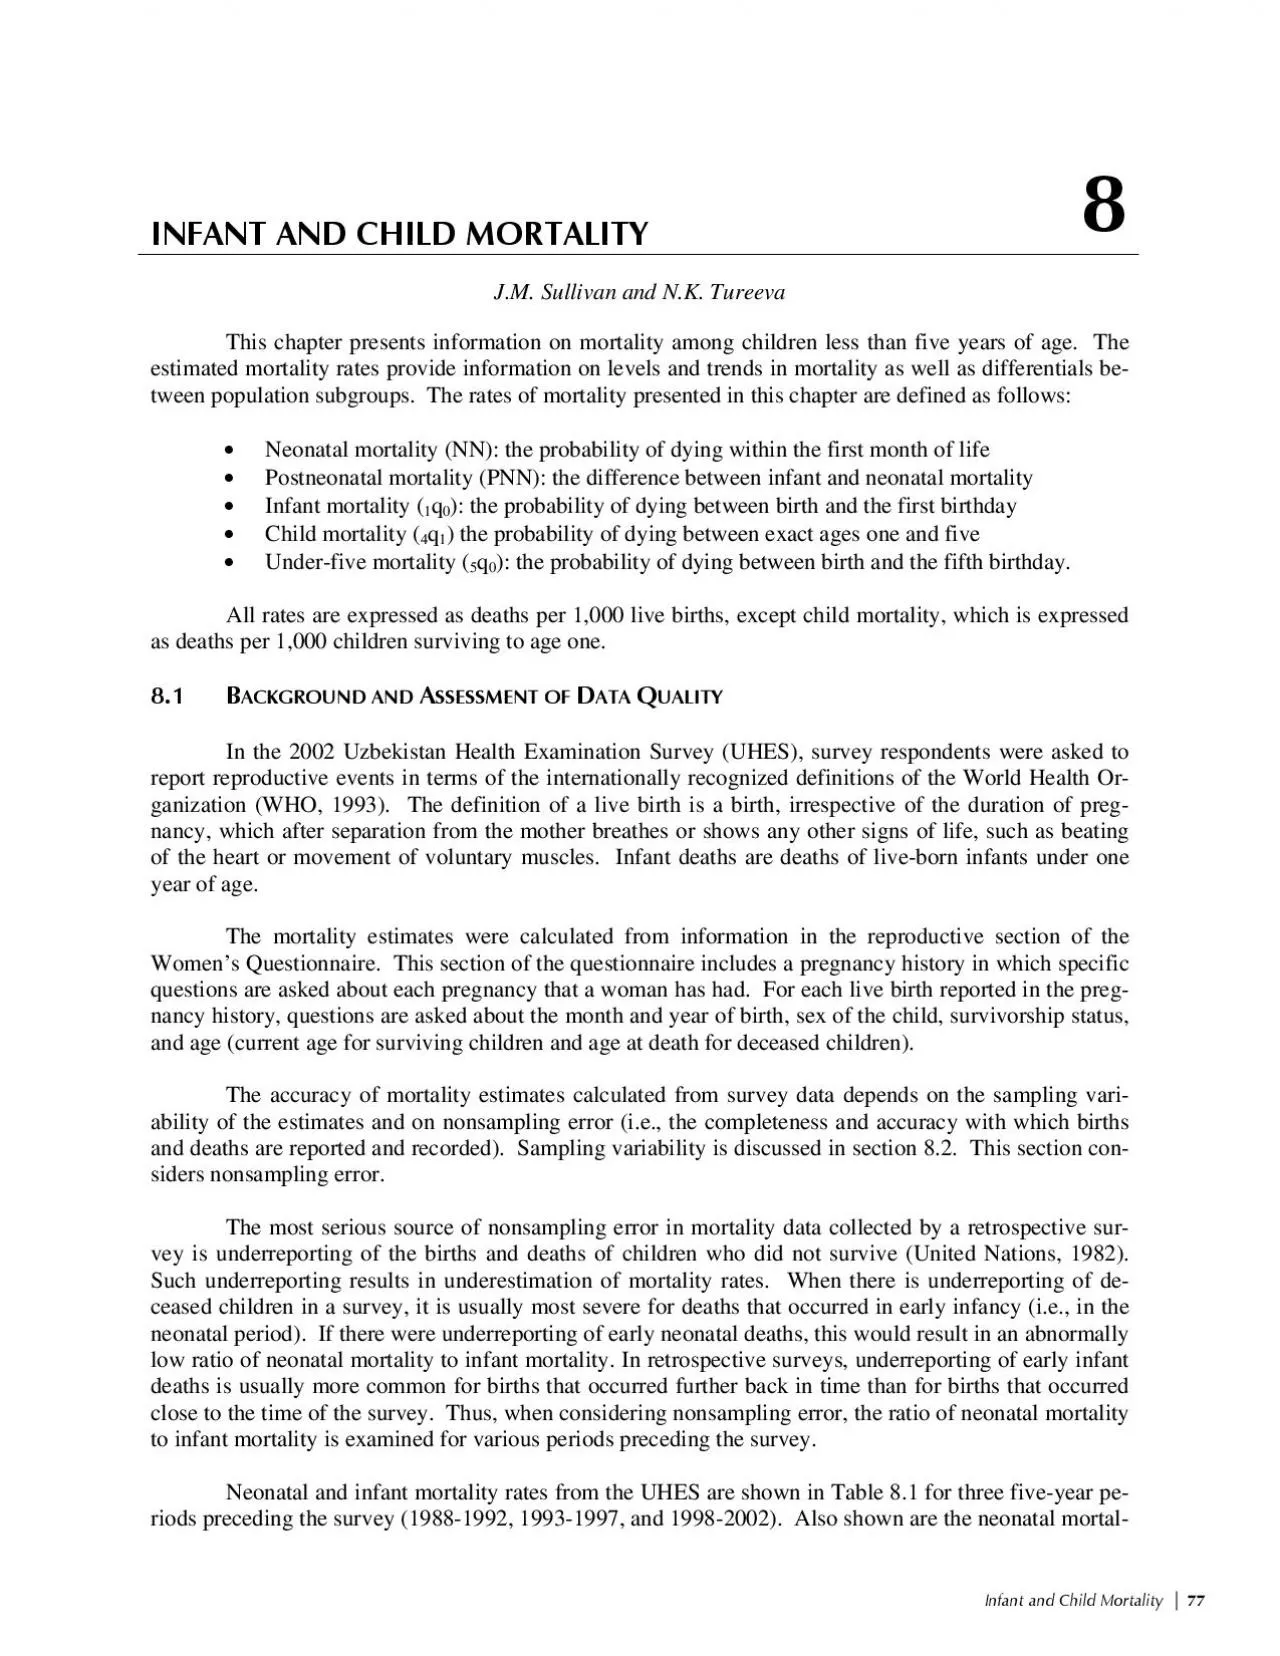
Infant and Child Mortality dent reporting error is typically more prevalent for periods more distant from the survey than for those closer to the survey. Bearing this in mind, it is appropriate to focus on the rates for the ten-year period preceding the survey, and the conclusion is that the infant mortality rate has remained basically un-changed over the past ten years at about 62 per 1,000. ECENT OURCES Recent infant mortality estimates for Uzbekistan are available from three national-level surveys: the 2002 UHES, the 2000 Multiple Indicator Cluster Survey (MICS), and the 1996 UDHS. All of these surveys used the World Health Organizations definitions of live birth and child death.Infant mortality rates are also available from the Ministry of Health. The MOH rates are based on data collected in a national registration system that relies on local health officials to register events fol-lowing protocols that were established during the Soviet era. These protocols define live births somewhat differently than the World Health Organization does. On
e difference is that a pregnancy ending at a ges-tation age of less than 28 weeks (or weighing less than 1,000 grams or measuring less than 35 centime-ters) is considered premature and is classified as a late miscarriageeven if signs of life are present at the time of deliveryunless the child survives for seven days. Only if the child survives the early neonatal period is it classified as a live birth. A second difference concerns full-term births (pregnancy ending at a gestation age of 28 weeks or more). The event is classified as a live birth if the child breathes at the time of delivery, but is considered a stillbirth if breathing is not evident at delivery (even though other signs of life are present). Thus, some events classified as miscarriages or stillbirths in the registration system would be classified as live births and infant deaths according to the WHO definitions used in the three surveys. In addition to the differences in definitions between the surveys and the registration system, there are differences in the methodology of data
collection. In all three surveys, information about births and child deaths was obtained from the mother. In contrast, data collection for the registration system re-quires that either a health official or a family member be proactive and take the initiative to register the occurrence of births and deaths of deceased children. Infant mortality estimates from the various sources are shown in Table 8.2 and Figure 8.1. It is evident that the estimates from the three surveys and the estimates based on the registration data represent different levels of mortality. The survey estimates are substantially higher than those from the MOH. For the most recent period (1998-2002), the survey estimate of infant mortality (62 per 1,000) is three times the MOH estimate (19 per 1,000). The 2002 UHES and the 1996 UDHS used similar data collection processes and direct estimation techniques to produce infant mortality estimates. The 2000 MICS employed a different methodology for both data collection and r
ate estimation. MICS estimates are based on the reported proportion dead of children ever born to respondents and involves the conversion of those proportions to a mortality ratea procedure known as the Brass Estimation Tech-nique (United Nations Childrens Fund, 2001). The important point here is that despite the differences in method-ology between these surveys, all IMR estimates are quite close and far exceed recent IMRs reported by the Ministry of Health. Infant and Child Mortality Mortality differentials by indicator of household economic stability (making ends meet) are in the expected direction, but the differences are modest. For children of women residing in households having great difficulty in making ends meet, infant mortality is 67 per 1,000, while for children of women in households that easily make ends meet, infant mortality is 60 per 1,000. EMOGRAPHIC IFFERENTIALS IN HILDHOOD The relationship between early childhood mortality and demographic variables is shown in Table 8.5. For most populations in Uzbekistan, male childr
en experience higher mortality than female children. Nationally, the level of infant mortality is 67 per 1,000 for males and 59 per 1,000 for females. Thus, in-fant deaths are 14 percent more likely among males than females. Differentials in infant mortality by age of mother or birth order are small except for the relatively high rate among children of birth order four or higher (78 per 1,000). There is a clear association between mortality risk and the length of the preceding birth interval. Children born after a short birth interval (i.e., less than 24 months after a preceding birth) are at greater risk of dying than those born after longer intervals. The infant mortality rate for births following an inter-val of less than 24 months (80 per 1,000) is greater than the rate for births following an interval of 24-35 months (64 per 1,000), and much greater than the rate for births following an interval of 36-47 months (32 per 1,000). This relationship suggests that some mortality reduction would result if the proportion of births occurring after a
short birth interval were reduced. Table 8.4 Early childhood mortality rates by socioeconomic characteristics Neonatal, postneonatal, infant, child, and under-five mortality rates for the ten-year period preceding the survey, by socioeconomic characteristics, Uzbekistan 2002 Neonatal Postneonatal Infant Child Under-five Socioeconomic mortality mortality mortality mortality mortality characteristic (NN) (PNN) (Residence Urban 26.8 16.1 42.9 11.0 53.4 Rural 37.9 36.6 74.6 14.0 87.5 Mother's education Primary/middle 58.8 35.8 94.6 8.4 102.2 Secondary 34.9 33.3 68.1 14.9 82.0 Secondary special 25.9 23.7 49.7 12.3 61.4 Higher 21.0 8.4 29.4 6.3 35.5 Ethnicity Uzbek 35.9 29.1 65.1 13.3 77.5 Other 18.4 28.4 46.8 9.8 56.1 Making ends meet Great difficulty 31.9 35.0 66.9 13.4 79.4 Some difficulty 34.3 28.0 62.4 12.0 73.6 A little difficulty 35.1 25.2 60.3 13.4 72.9 Easily 34.4 26.0 60.4 12.6 72.2 Total 33.9 29.1 62.9
12.9 75.0 Computed as the difference between the infant and the neonatal mortality rates Infant and Child Mortality ERTILITY EHAVIORMany research studies have shown a strong relationship between fertility patterns and childrens risk of dying. Typically, mortality risks are greater for children born to mothers who are too young or too old, who are born after a short birth interval, or who have a high birth order. In this analysis, a mother is classified as too young if she is less than 18 years of age, and too old if she is over 34 years of age. A short birth interval is defined as a birth occurring within two years of the previous birth, and a child is of high birth order if the mother had previously given birth to four or more children. Table 8.7 shows the distribution of children born in the five years before the survey by risk cate-gory. While first births to women age 18-34 are shown in Table 8.7, they are not included in the analysis because they are not considered an avoidable risk. Column 1 of Table 8.7 shows that, in the five
-year period before the survey, 27 percent of births were in a single high-risk category and 7 percent were in a multiple high-risk category. Column 2 of the table shows risk ratios for high-risk births relative to births not having any high-risk characteristics. The risk ratio for births in a single high-risk category is 1.07 (i.e., elevated by 7 per-cent over births in the not-in-any-high-risk category). For births with multiple high-risk characteristics, the risk ratio is 2.52 (i.e., elevated by 152 percent over births in the not-in-any-high-risk category). Column 3 of Table 8.7 looks to the future and addresses the question: how many currently mar-ried women have the potential for having a high-risk birth? The results were obtained by simulating the risk category into which a birth to a currently married woman would fall if she were to become pregnant at the time of the survey. For example, a woman who is 37 years old at the time of the survey and has had four previous births, the last of which occurred three years before the survey, would be
classified in the multiple high-risk category age 34 and birth order 3, which carries a risk ratio of 3.03 (i.e., elevated by 203 percent over births in the not-in-any-high-risk category). Table 8.6 Early childhood mortality by womens status Neonatal, postneonatal, infant, child and under-five mortality rates for the ten-year period preceding the survey, by womens status indicators, Uzbekistan 2002 Neonatal Postneonatal Infant Child Under-five Indicator of mortality mortality mortality mortality mortality womens status (NN) (PNN) ( woman has final say 0 42.6 59.5 102.0 8.7 109.9 1-3 32.2 26.8 59.0 10.4 68.8 4-6 37.3 23.1 60.5 16.3 75.8 7-8 26.0 24.3 50.3 15.6 65.2 Number of reasons to 0 26.7 65.7 92.4 6.7 98.4 1-2 40.8 53.5 94.2 8.0 101.5 3-4 33.4 26.2 59.6 13.4 72.1 Total 33.9 29.1 62.9 12.9 75.0 Computed as the difference between the infant and the neonatal mortality rates Either by herself or jointly with others Survey2002Uzbekistan Health Examination Surv