

James Ang Yingmei Cheng Sarah Fulmer Source Frydman and Jenter 2010 CEO Compensation Working paper Agency Problem Incentive compensation aligns management interest with shareholders ID: 239858
Download Presentation The PPT/PDF document "Clawing Back Executive Compensation" is the property of its rightful owner. Permission is granted to download and print the materials on this web site for personal, non-commercial use only, and to display it on your personal computer provided you do not modify the materials and that you retain all copyright notices contained in the materials. By downloading content from our website, you accept the terms of this agreement.


Slide1
Clawing Back Executive Compensation
James
AngYingmei ChengSarah FulmerSlide2Slide3
Source:
Frydman
and Jenter (2010) CEO Compensation, Working paperSlide4
Agency ProblemIncentive compensation aligns management interest with shareholders – Mehran (1995); Jensen and Murphy (1990)Incentive compensation, particularly stock options, encourages management to manipulate earnings – Klinger et al. (2002)Slide5
CEO
CompanyRestatement Period
Total Incentive CompensationStock / Option ProfitsBernie Ebbers
MCI
(WorldCom)
1999-2002;
$69.9
billion
$100 million
$430 million “loan” for stock
Maurice Greenberg
AIG
2000-2005;
$3.4 billion
$121.7 million
Richard
Scrushy
HealthSouth
1996-2002;
$2.6 billion
$259 million
$74 million
William McGuire
United
Health
1994-2005;
$1.5 billion
$246.3 million
$390 million
Paul
Allaire
Zerox
1997-2000;
$1.4 billion
$41.6 million
$35.3 million
Sanjay
Kumar
Computer Associates
1999-2000;
$2.2 billion
$30.7 million
Joseph
Nacchio
Qwest Communications
2000-2001;
$2.5 billion
$76.4 million
$52 millionSlide6
Solutions to Agency ProblemMonitoring by the Board of DirectorsThe greater the CEO power, the less effective the Board monitoring – Hermalin and Weisbach
(1998)Board monitoring weakens over the CEO’s tenure – Ryan et al. (2009)Directors have an incentive to appease management – Bebchuck
and Fried (2003)Shareholder Activism / Shareholder LitigationShareholder activism is generally ineffective in changing corporate policy – Romano (2003); Klein and Zur (2009); Admati and Pfleiderer
(2009)
Government Intervention /
Clawback
Provisions
SOX Section 304
Dodd-Frank Section 954Slide7
Overview of ClawbacksContractual or Statutory provision that allows a firm to recover fraudulently or erroneously paid compensationSOX 304requires “misconduct” to trigger
clawbackALL incentive compensation AND profits from the sale of stock and options for 12 months following misstatementDodd-Frank 954
All exchange-listed firms must adopt Clawback PoliciesApplies to all “material” restatements (does not require misconduct)Only recovers “excess” incentive compensationDoes not apply to recover profits from sale of stock and options Slide8Slide9
Incentives to ManipulateEarnings manipulation is more prevalent where CEOs are “incentivized” – Bergstresser and Philippon
(2006)Executives exercise “unusually large” amount of options and sell large amounts of stock during periods of misreporting – Erickson et al. (2006)
Executives manipulate earnings to maintain stock prices or to prevent price decreases – Efendi et al. (2007); Johnson et al. (2008). Executives manipulate: (a) to prevent decline in earnings; (b) to avoid missing analyst forecasts; and (c) to avoid reporting negative earnings – Burgstahler and
Dichev
(1997
)
CEOs
at poorly performing firms are more likely to be terminated – Warner et al. (1988);
Arthuad
-Day et al. (2006
)Slide10
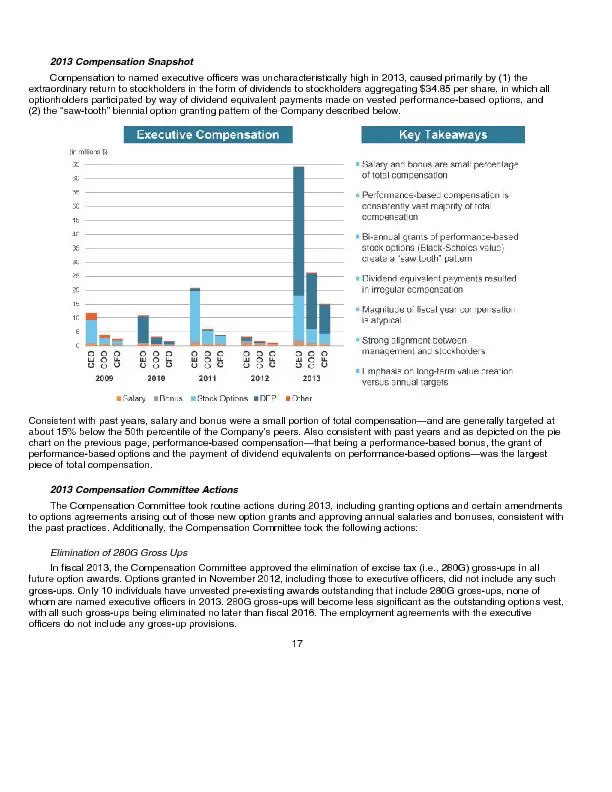
Hypothesis DevelopmentH1: The amount recoverable under Dodd-Frank will not be economically significant
H2: CEOs manipulate earnings to profit from stock sales and option exercisesH3: CEOs manipulate earnings to avoid terminationSlide11
Current Incentive CompensationFirms engage in more manipulation where executives are “incentivized” – Bergstresser and Philippon (2006
)The more Equity / Total Compensation, the greater probability of accounting fraud – Erickson et al. (2006)Slide12
Enforcement of ClawbacksFirms that voluntarily adopt clawback provisions have better financial reporting quality (
deHaan et al., 2012) and lower probability of future restatement (Chan er al., 2011; Chen et al., 2012)
No evidence of enforcement, even in firms that voluntarily adopt clawback provision- Addy et al. (2011); Babenko et al. (2012)Slide13
Hypothesis DevelopmentH1: The amount recoverable under Dodd-Frank will not be economically significantH2
: CEOs manipulate earnings to profit from stock sales and option exercisesH3: CEOs manipulate earnings to avoid terminationSlide14
Stock and Option ProfitsInsiders sell more stock during misreported period – Summers and Sweeney (1998); Beneish (1999);
Beneish and Vargus (2002); Agrawal and Cooper (2006)
CEOs exercise more options during misreported periods – Kedia and Philippon (2009); Burns and Kedia (2008); Efendi
et al. (2007)
Greater earnings management in years the CEO exercises options –
Bergstressor
and
Philippon
(2006)Slide15
Hypothesis DevelopmentH1: The amount recoverable under Dodd-Frank will not be economically significantH2
: CEOs realize economically significant indirect gains from the sale of previously awarded stock and option grantsH3: CEOs receive indirect benefits from manipulating earnings by reducing their risk of being terminatedSlide16
Probability of TerminationCEO turnover increases following poor firms performance – Huson et al. (2001)CEOs who fail to meet analysts expectations face a higher risk of termination – Farrell and
Whidbee (2003)51% of CEOs are terminated within two years following a restatement – Desai et al. (2006)
93% of executives are terminated following SEC investigations for fraud – Karpoff et al. (2008)Slide17
Summary of ResultsH1: Effectiveness of Dodd-FrankCan recover something from 93% of the CEOs
Potential to recover 73% of Direct Gains (i.e. “excess incentive compensation”)Economically small amount – average dollar amount recoverable $153,00 per CEO, per fiscal yearThe remaining 27% of Direct Gains are paid more than three years prior to restatement; thus are unreachable under Dodd-Frank
Capture less than 1% of total gain from manipulation (Direct and Indirect Gains)Slide18
Summary of ResultsH2: Gains from Insider Trading Average CEO earns $3.7 million in stock gain and $3.8 million in option gains (per CEO, per year)Average CEO profits by nearly $18 million during the misreported period
H3: Probability of Termination
18% of the sample are able to reduce their probability of termination by at least 10%11% of the sample are able to reduce their probability of termination by at least 50% as result of inflation. Thus “survival” is a credible motive. Slide19
Sample SelectionSlide20
DataCompensation Data – ExecucompFinancial Data – 10-k Reports (SEC EDGAR)
Termination Data – Lexis-Nexis SearchesParrino (1997) Methodology
Stock and Option Data – Thomson Reuter’s Insider Filing Database Slide21
Descriptive StatisticsSlide22
Descriptive StatisticsSlide23
Descriptive StatisticsSlide24
Descriptive StatisticsSlide25
Descriptive StatisticsSlide26
ResultsEffectiveness of Dodd-FrankDirect Gains (i.e. “Excess Incentive Compensation”)Stock and Option Gains
Probability of TerminationSlide27
CEOs are rewarded for positive performance and shielded from negative performance – Gaver and Gaver (1998)Examine positive and negative performance variables separately
Cash Incentive = α + β
1Log(Assets) + β2NI_Pos + β3NI_Neg +
ε
Equity Incentive = α + β
1
Log(Assets) + β
2
Ret_Pos + β
3
Ret_Neg + ε
Direct GainsSlide28Slide29Slide30
Direct GainsDodd-Frank Section 954: “in excess of what would have been paid to the executive
officer under the accounting restatement”Direct Gain (i.e. “Excess Incentive Comp.”)
= Unrestated Compensation – Restated CompensationMethodology: Apply regression coefficients to estimate “Unrestated
” Compensation and “Restated” Compensation
“Restated” stock returns based on what price
would have been
absent manipulation
Johnson et al. (2008) find stock prices drop 14.9% upon disclosure of fraud;
Desai et al. (2006);
Palmrose
(2004
);
Kedia
and
Philippon
(2009)
find 3-day market returns of -10% to -11% upon restatement
announcement
;
Burk (2010) finds 1-day decline of 5.5%.
Lower Bound = 5%; Upper Bound = 15%Slide31
Direct GainsMethodology: Apply regression coefficients to estimate (1) “Unrestated” Compensation and (2) “Restated” Compensation
“Direct Cash Gain” = Cash-Based Incentive
Unrestated – Cash-Based IncentiveRestated α + β
1
Log(Assets)
+
[β
2
NI
U
_Pos
+
β
3
NI
U
_Neg] – [β
2
NI
R
_Pos
+
β
3
NI
R
_Neg]
+
ε
“Direct Equity Gain” = Equity-Based
Incentive
Unrestated
–
Equity-Based
Incentive
Restated
α +
β
1
Log(Assets) + [β
2
Ret
U
_Pos
+
β
3
Ret
U
_Neg] – [β
2
Ret
R
_Pos
+
β
3
Ret
R
_Neg]
+ εSlide32
Current Incentive CompensationSlide33
Current Incentive Compensation
SOX Section 304:
“any bonus or other incentive-based or equity-based
compensation . . . and any profits realized from the sale
of securities”Slide34
Dodd-Frank
ClawbackSlide35
ResultsEffectiveness of Dodd-FrankExcess Incentive Compensation
Stock and Option Gains (Indirect Gains)Probability of TerminationSlide36
Stock and Option ProfitsMethodology: Collect insider trading from Thomson ReutersInsider transactions for 217 firm-year observations: 175 stock gains (98 CEOs)158 option gain
(93 CEOs) Stock Gain = (Price Paid – Basis) x Shares
Option Gain = (Market Price – Exercise Price) x OptionsSlide37
Stock and Option ProfitsSlide38
Stock and Option ProfitsSlide39
Stock and Option ProfitsSlide40
Dodd-Frank
ClawbackSlide41
Dodd-Frank
Clawback
Recovery Under
Clawback
Provisions
Dodd-Frank Sarbanes Oxley
$64.6 million $1.19 billion
of $4.4 billion Total Gains (Direct and Indirect) Slide42
ResultsEffectiveness of Dodd-FrankExcess Incentive CompensationStock and Option Gains
Probability of TerminationSlide43
Fired = α + β1Log(Assets) + β2Tenure + β3NI +
β4Neg_NI + β5
NI_Down + β6Loss2 + ε Fired = Neg_NI =
NI_Down
=
Loss2 =
1 if
CEO fired (involuntary turnover
)
0 otherwise
(no turnover or voluntary
)
1
if net
income
is
negative
0 otherwise
1
if net income decreased from prior
year
0 otherwise
1
if
net income
is negative for
prior two
years
0 otherwiseSlide44Slide45Slide46
ΔProb = ProbUnrestated
– ProbRestated
ProbRestated
Δ
Prob
< -12.763%
“Termination Avoidance CEOs”Slide47
Probability of TerminationGain from Delayed Termination: (Δ
TerminationRisk for CEO
k) x (CEOk Comp
t-1
) x (Number of Years)
Average
gain of $22.47 million (per CEO)
Aggregate gain of $1.55 billion (aggregate)Slide48
RobustnessSlide49Slide50
RobustnessPost-Dodd-Frank PeriodNEED TO ADD NOTESSlide51
ConclusionProblem: CEOs inflate earnings for personal gain Average CEO increases wealth by $18 million as a result of misreporting.
Only a small portion of Total Gains subject to clawbackA large portion of CEOs are able to avoid or delay termination by misreporting
Purpose of Section 954: To hold executives accountable by removing incentive to manipulateLimitations: does not require recovery profits from the sale of stock and option exercisesSlide52
ConclusionResult: Dodd-Frank has broad reach but limited application. Potential to recover something from 93% of CEOsPotential to recover
73% of Direct Gains Does not reach Indirect Gains Limited recovery of less than 1% of
Total GainsEffectiveness: Depends on how vigorously boards willing to purse executives. Personal and professional relationshipsCost of litigation > Amount recoverable