
Photo Lee Rodegerdts Contractors Kittelson amp Associates Inc Lee Rodegerdts Principal Investigator Brian Ray Pete Jenior Zachary Bugg Institute for Transportation Research amp Education ID: 194063
Download Presentation The PPT/PDF document "NCHRP Project 03-100: Evaluating the Per..." is the property of its rightful owner. Permission is granted to download and print the materials on this web site for personal, non-commercial use only, and to display it on your personal computer provided you do not modify the materials and that you retain all copyright notices contained in the materials. By downloading content from our website, you accept the terms of this agreement.


Slide1
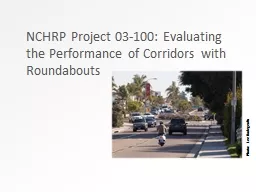
NCHRP Project 03-100: Evaluating the Performance of Corridors with Roundabouts
Photo: Lee RodegerdtsSlide2
Contractors
Kittelson & Associates, Inc.Lee Rodegerdts - Principal
InvestigatorBrian Ray, Pete Jenior, Zachary BuggInstitute for Transportation Research & Education (North Carolina State University)Bastian Schroeder
Texas Transportation Institute (Texas A&M University)
Marcus Brewer
Write Rhetoric
Danica RhoadesSlide3
Project Panel
Phil Demosthenes, consultant (chair)Stephen Bass, Kansas DOTWylie
Bearup, City of Phoenix, AZSarah Bowman, Walkable Communities, Inc.Robert Fenton, Ohio State UniversityTheron
Knause
, Virginia DOT
Mark
Lenters
,
Ourston
Roundabout Engineering, Inc.
Avijit
Maji
, Maryland State Highway Administration
Dina
Swires
, Washington State DOT
Rich Cunard, TRB
Hillary
Isebrands
, FHWA
Lori
Sundstrom
, NCHRP Program OfficerSlide4
Presentation overview
Project objectiveProject scopeData collection and sample of preliminary findings
Project products
Photo: Lee RodegerdtsSlide5
Project Objective
Document examples of existing corridorsProvide evaluation methods for alternatives analysisFocus on three or more roundabouts in series
Photo: Lee RodegerdtsSlide6
Project Scope
Document existing roundabout corridorsCollect and evaluate field dataIdentify “lessons learned” from agencies
Prepare tools and guidance for alternatives evaluationsPrepare predictive tools based on observed field data for incorporation into key resource documents such as HCM
Prepare “Corridor Comparison Document” to demonstrate broader evaluation processSlide7
Site Selection
58 roundabout corridors identified in USNine corridors selectedGeographically dispersed across the U.S., with some grouping for data collection efficiency
Mix of urban, suburban, and rural environmentsMix of single-lane and multilane roundaboutsWide range of circumstances leading to each corridorSlide8
Data Collection Corridors
MD 216, Scaggsville, MD (pilot study site)La Jolla Boulevard, San Diego, CA (pilot study site)
Old Meridian Street, Carmel, INSpring Mill Road, Carmel, INBorgen Boulevard, Gig Harbor, WASR 539, Whatcom County, WA
Golden Road, Golden, CO
Avon Road, Avon, CO
SR 67, Malta, NYSlide9
Data Collection Methods
Travel time runs using GPSBluetooth™ data collection (pilot sites only)Video recording of intersections (primarily for peak hour turning movement extraction)
Spot speed samplesPhotographs and field notesInterviews with corridor owners/operatorsData collection methods refined after pilot study locations (focused on GPS instead of Bluetooth)Slide10
La Jolla Boulevard, San Diego, California(pilot study site)
Image: © Google MapsSlide11
Example Time-Space Trajectory(La Jolla Boulevard SB, San Diego, CA)Slide12
Example Speed Profile for Urban Corridor(La Jolla Boulevard SB, San Diego, CA)Slide13
SR 539, Whatcom County, Washington
Image: © Google MapsSlide14
Example Speed Profile for Rural Corridor(SR 539 NB, Whatcom County, WA)Slide15
SR 67, Malta, New York
Image: © Google MapsSlide16
Example Speed Profile through Interchange(SR 67 EB, Malta, NY)Slide17
Corridor Owner/Operator Interviews
Wide variety of experiences leading to development of corridorsReinforces motivation of Corridor Comparison Document to evaluate corridors on case-by-case basisSlide18
Corridor Owner/Operators – Lessons Learned
Once several roundabouts built on a corridor, more are likelyIncreased acceptance of roundabouts
Concerns about signal queue spillbackAccess managementConsistency within corridorTraffic analysis typically analyzed roundabouts in isolationAgency champion is keySlide19
Modeling
New predictive tools for estimating operational performance of roundabout corridorsCreated for for incorporation into HCM Chapters 17 (Urban Streets) and 21 (Roundabouts) or their supplements to enable signals-versus-roundabouts predictive comparisons
Initial briefings provided to HCQS subcommitteesSlide20
Modeling FrameworkSlide21
Modeling Framework
New models developed by this project:
Free-flow speed (Step B)
Roundabout Influence Area Length (Step C)
Geometric Delay (Step H)
Impeded Delay (Step I) – analogous to control delay
Fits into existing Urban Streets ProcedureSlide22
Segment and Sub-Segment DefinitionsSlide23
Free-Flow Speed ModelsSlide24
Roundabout Influence Area Length ModelsSlide25
Geometric Delay ModelsSlide26
Impeded Delay ModelsSlide27
Operations Comparisons with “Equivalent Signalized Corridors”
High-level comparison to suggest trends if any“Equivalent” signalized corridors developed for each roundabout corridor
Estimate travel time (TT) performance using HCM-based and simple simulation-based analysisCompare estimated TT to field-measured roundabout performance Slide28
Operations Comparisons with “Equivalent Signalized Corridors”
Neither control option consistently results in reduced travel time or delay for through routesSite-specific evaluation is key
Roundabouts tends to improve travel time for routes with a left turn onto or off a corridorRoundabouts are more likely to improve travel time with irregular intersection spacingSlide29
Corridor Comparison Document
Chapter 1: IntroductionChapter 2: Users of ArterialsChapter 3: Project Planning Process
3.1 Project Initiation (incl. understanding of context)3.2 Concept Development3.3 Alternatives AnalysisChapter 4: Performance MeasuresChapter 5: Example ApplicationsSlide30
Understanding ofContext
Select performance metrics that are important for the corridor being studied
Develop and evaluate reasonable alternativesSlide31
Potential PerformanceMeasures
Categories:
Quality of Service
Safety
Environmental
Costs
Community Values
OtherSlide32
Example Applications
Show use of:Corridor Comparison DocumentRoundabout travel time model developed for this project
ExamplesNew suburban greenfield corridorCommunity enhancement on existing urban corridorExisting rural corridor in context sensitive, suburbanizing area
Existing suburban corridor undergoing operations and safety evaluationSlide33
Thank you!
Photo: Lee Rodegerdts