
Tropical Cyclone Models Track and Intensity Michael J Brennan National Hurricane Center NOAA Southeast and Caribbean Regional Team Webinar 10 May 2016 Tropical Weather Outlook Tropical Cyclone Track ID: 530088
Download Presentation The PPT/PDF document "Tropical Weather Outlook" is the property of its rightful owner. Permission is granted to download and print the materials on this web site for personal, non-commercial use only, and to display it on your personal computer provided you do not modify the materials and that you retain all copyright notices contained in the materials. By downloading content from our website, you accept the terms of this agreement.


Slide1
Tropical Weather Outlook
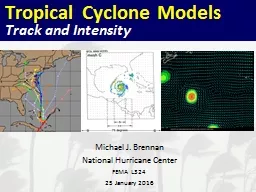
Tropical Cyclone Models
Track and Intensity
Michael J. Brennan
National Hurricane CenterNOAA Southeast and Caribbean Regional Team Webinar10 May 2016Slide2
Tropical Weather Outlook
Tropical Cyclone Track
Overview
Track forecasting is a relatively simple problem
“Cork in a stream” analogyImportant atmospheric features that control track are relatively large and easy to measure
2Slide3
Tropical Weather Outlook
Tropical Cyclone Models
Spaghetti Plots
Which of the following statements about publicly available TC track model plots is not true?
The models shown accurately convey the uncertainty in the track forecastSome of the best performing track models are not shownSome of the models shown are not used for TC track forecastingThe spread of the BAM models provides a clue about the amount of vertical wind shear3Slide4
Tropical Weather Outlook
Tropical Cyclone Models
Spaghetti Plots
What does this set of lines represent?
Do they accurately convey the uncertainty in the track forecast?Are they all created equal? What’s missing? 4Slide5
Tropical Weather Outlook
Tropical Cyclone Models
Spaghetti Plots
5Slide6
Tropical Weather Outlook
Tropical Cyclone Models
Extrapolated Motion
Useful if models aren’t handling initial motion well in the very short term
No utility beyond 6 or 12 hours at most6Slide7
Tropical Weather Outlook
Tropical Cyclone Models
Climatology and Persistence
Used as a baseline to compare other forecasts with
Not used as a forecast tool7Slide8
Tropical Weather Outlook
Tropical Cyclone Models
Global Models
Best forecast models for TC track
Developed for general weather forecastingHandle large-scale pattern and steering flow wellCan’t see details of TC inner coreSometimes struggle with storm structure and intensity, which can affect track forecasts8Slide9
Tropical Weather Outlook
Tropical Cyclone Models
Regional Hurricane Models
Developed specifically for TCs
Higher resolution means they can potentially do better job of handling interactions between TC and environmentLimited coverage means features far away from TC may not be handled as well, which can degrade longer-range forecasts9Slide10
Tropical Cyclone Models
Consensus Models
Typically the best track guidance, especially if the member models all show a similar forecast scenario
Doesn’t work well when members forecast very different track scenarios10Slide11
Consensus Example
Model errors are often random (e.g., small variations on a common theme)
Consensus
frequently cancels out these random errors, resulting in a better forecastConsensus Models
Examples – Tropical Storm Cristobal (2014)11Slide12
Consensus Example
Model errors are often random (e.g., small variations on a common theme)
Consensus
frequently cancels out these random errors, resulting in a better forecastConsensus Models
Examples – Tropical Storm Cristobal (2014)12Slide13
Consensus approach doesn’t always work, especially when model scenarios are completely differentSometimes the forecaster might want to exclude certain models and form a “selective consensus”, if the discrepancies among the models can be resolvedResolving these discrepancies is very difficultConsensus Example
GFSI
GFDI
HWFIERGITVCAEMXI
Consensus ModelsExamples – Hurricane Joaquin (2015)13Slide14
Model Plots14
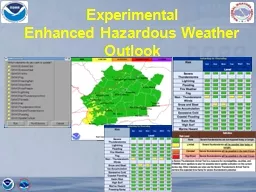
Looking at publically available model track plots, doesn’t always show the whole picture Some of the best guidance (ECMWF, FSSE) isn’t always
available
No sense of continuity from cycle to cycle for the various models, trends, etc. Some users/viewers don’t have the forecaster’s perspective and knowledge to know model strengths and weaknesses, trends, etc. Tropical Cyclone Models
Spaghetti Plots – Caution!Slide15
Yearly Track Model Performance Trends15Official forecasts (OFCL) were very skillful, near or better than the consensus aidsTVCA was most skillful guidance through 48 hEMXI was best individual model, and beat OFCL at
48 h and beyond and was best guidance at days 3-5GFSI
was second best individual
model with skill just below OFCL and consensus modelsGFS ensemble mean (AEMI), HWFI, and EGRI next best modelsGHMI and CMCI trailed
Atlantic Track Model Errors2013–2015Slide16
Yearly Track Model Performance Trends16Due to model changes and other factors, the best performing model often varies from season to season
Track Model Trends
Best 5-day Track Model
2001–2015Slide17
Forecast ContinuityPrevious official forecast exerts a strong constraint on the current forecastCredibility can be damaged by making big changes from one forecast to the next, and then having to go back (flip-flop, windshield-wiper)Changes to the previous forecast are normally made in small incrementsWe strive for continuity within a given forecast (e.g., gradual changes in direction or speed from 12 to 24 to 36 h, etc.) As a result, NHC official forecasts are often slower to reflect big changes than the model guidance17
NHC Forecast Philosophy
Forecast ContinuitySlide18
Dennis Guidance 6 July 1200 UTCOfficial forecast near model consensus in western Florida panhandle
Forecast Continuity
Hurricane Dennis – 12Z 6 July 2005
18
Official ForecastConsensusSlide19
Dennis Guidance 6 July 1800 UTCGuidance shifts sharply westward Official forecast nudged westward into Alabama
Forecast Continuity
Hurricane Dennis – 18Z 6 July 2005
19
Official ForecastConsensusSlide20
Dennis Guidance 6 July 1800 UTCLittle overall change to guidance, but Navy model shifts slightly eastwardLittle change in official forecast
Forecast Continuity
Hurricane Dennis – 00Z
7 July 2005
20Official ForecastConsensusSlide21
Dennis Guidance 6 July 1800 UTCRest of the guidance shifts eastwardOfficial forecast is now near the center of the guidance and close to the actual track
Forecast Continuity
Hurricane Dennis – 06Z
7 July 2005
21Official ForecastConsensusSlide22
“Invests” are suspect areas that NHC is interested in looking at more closely for a variety of reasonsModel guidance for invests should be treated with extreme cautionGuidance for invests can be unreliable and show large swings from one cycle to the next for several reasons:The models may not have a good representation of the invest in the initial analysis (can be too weak, too strong, or in the wrong place)The initial position and motion of invests can be highly uncertainInvests can be relocated many 10s of miles from one cycle to the next as new data become available Always refer to the TWO and to products from your local WFO for information about possible tropical cyclones! 22
Tropical Cyclone Models
Guidance for InvestsSlide23
18Z 20 August 2014
Guidance for Invests
Pre-Cristobal – 18Z 20 Aug. 2014
235-day verifying locationSlide24
00Z 21 August 2014
Guidance for Invests
Pre-Cristobal – 00Z 21 Aug. 2014
245-day verifying locationSlide25
06Z 21 August 2014
Guidance for Invests
Pre-Cristobal – 06Z 21 Aug. 2014
255-day verifying locationSlide26
12Z 21 August 2014
Guidance for Invests
Pre-Cristobal – 12Z 21 Aug. 2014
265-day verifying locationSlide27
18Z 21 August 2014
Guidance for Invests
Pre-Cristobal – 18Z 21 Aug. 2014
275-day verifying locationSlide28
00Z 22 August 2014
Guidance for Invests
Pre-Cristobal – 00Z 22 Aug. 2014
285-day verifying locationSlide29
06Z 22 August 2014
Guidance for Invests
Pre-Cristobal – 06Z 22 Aug. 2014
295-day verifying locationSlide30
12Z 22 August 2014
Guidance for Invests
Pre-Cristobal – 12Z 22 Aug. 2014
305-day verifying locationSlide31
18Z 22 August 2014
Guidance for Invests
Pre-Cristobal – 18Z 22 Aug. 2014
315-day verifying locationSlide32
00Z 23 August 2014
Guidance for Invests
Pre-Cristobal – 00Z 23 Aug. 2014
325-day verifying locationSlide33
06Z 23 August 2014
Guidance for Invests
Pre-Cristobal – 06Z 23 Aug. 2014
335-day verifying locationSlide34
12Z 23 August 2014
Guidance for Invests
Pre-Cristobal – 12Z 23 Aug. 2014
345-day verifying locationSlide35
18Z 23 August 2014(first advisory issued)
Guidance for Invests
Cristobal – 18Z 23 Aug. 2014
355-day verifying locationSlide36
00Z 24 August 2014
Guidance for Invests
Cristobal – 00Z 24 Aug. 2014
365-day verifying locationSlide37
06Z 24 August 2014
Guidance for Invests
Cristobal – 06Z 24 Aug. 2014
375-day verifying locationSlide38
12Z 24 August 2014
Guidance for Invests
Cristobal – 12Z 24 Aug. 2014
385-day verifying locationSlide39
GFS forecast tracks before Cristobal formed
Guidance for Invests
Cristobal – GFS Forecasts Before Genesis
39Slide40
GFS forecast tracks after Cristobal formed
Guidance for Invests
Cristobal – GFS Forecasts After Genesis
40Slide41
Tropical Cyclone IntensityMuch more complex forecast problem than track Involves interactions between thunderstorms in the core, the environment, and atmosphere-ocean interactionsImportant factorsTrackWind, temperature, and moisture patterns in the core and the near environmentInternal processes, such as eyewall replacement cycles, that are poorly understood41
Tropical Cyclone Intensity
OverviewSlide42
Tropical Cyclone IntensityStatistical models (SHIPS, LGEM) only tell us normal behavior in a given situationExtremely difficult to forecast unusual or extreme changes in intensityConsequently, rapid changes in intensity are rarely shown in the official forecastDynamical models (HWRF, GFDL) have typically lagged statistical models, although HWRF is showing signs of improvementIntensity consensus has shown the most skill over the past few years Official forecast tries to maintain continuity with previous forecast, if possible42
Tropical Cyclone Intensity
OverviewSlide43
Yearly Track Model Performance Trends43Official forecasts (OFCL) skillful at all times, near or better than the top modelsFSSE a little better than IVCN at most forecast timesHWFI, DSHP
, and LGEM were strong performers, not far from the consensus
aidsGHMI
not competitive and had little/no skill at days 4-5GFSI had some skill, especially at longer lead timesEMXI had little to no skill
Atlantic Intensity Model Errors2013–2015Slide44
Thank You44
Tropical Cyclone Models