
LAMBDA K K Limit Type Precision Severity Precision Severity Precision Severity Stand Warning 02 224 180 Action 02 02 281 196 210 180 Lab Action 02 02 281 303 180 Indus ID: 846903
Download Pdf The PPT/PDF document "L37122016 327 4 Control Charts In Sec..." is the property of its rightful owner. Permission is granted to download and print the materials on this web site for personal, non-commercial use only, and to display it on your personal computer provided you do not modify the materials and that you retain all copyright notices contained in the materials. By downloading content from our website, you accept the terms of this agreement.


1 L-3712-2016 32-7 4. Control Charts. I
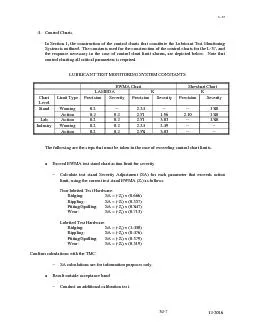
L-3712-2016 32-7 4. Control Charts. In Section 1, the construction of the control charts that constitute the Lubricant Test Monitoring System is outlined. The constants used for the construction of the control charts for the L-37, and the response necessary in the case of control chart limit alarms, are depicted below. Note that control charting all critical parameters is required. LUBRICANT TEST MONITORING SYSTEM CONSTANTS EWMA Chart Shewhart Chart LAMBDA K K Limit Type Precision Severity Precision Severity Precision Severity Stand Warning 0.2 -- 2.24 -- -- 1.80 Action 0.2 0.2 2.81 1.96 2.10 1.80 Lab Action 0.2 0.2 2.81 3.03 -- 1.80 Industry Warning 0.2 0.2 2.24 2.49 -- -- Action 0.2 0.2 2.88 3.03 -- -- The following are the steps that must be taken in the case of exceeding control chart limits. L-3712-2016 32-8 The following industry issues are handled by the TMC and do not re
2 quire individual laboratory Exceed EWMA
quire individual laboratory Exceed EWMA industry chart action limit TMC to notify surveillance panel chairman. Meeting of the TMC and the surveillance panel required to determine course of action. Exceed EWMA industry chart warning limit TMC to notify surveillance panel chairman. Coordination of TMC and surveillance panel required to discuss potential problem. 12-2016 D5800 Volatility by Noack Test Reference Oil Targets Effective Dates Sample Evaporation Loss Oil n From 51 NA*** 2000092518.13 0.42 52 NA*** 2000092513.39 0.40 59 20000926 2003072013.61 0.49 33 20030721 *** 13.75 0.61 53 NA*** 2000092522.30 0.55 54 NA*** 2000092523.54 0.67 55 NA*** 2000092516.21 0.48 60 20000926 2003072016.39 0.66 32 20030721 *** 17.09 0.76 58 59 20000926 2003072014.46 0.52 37 20030721 *** 15.20 0.72 VOLD1227 20130918 *** 12.52 VOLE1227 20130918 *** 16.74 Effective for all tests completed on or
3 after this date. *** = currently in effe
after this date. *** = currently in effect. viation of data from 2014-2016 X History of Industry Correction Factors Appendix B B-4 10-2016 Area Condition Description From To T-12 *** *** All tests using UUXO Hardware Multiply Average Top Ring Weight Loss by 0.849 Multiply Average Cylinder Liner Wear by 0.566 = exp[ (ln(Lead) x 0.797) ] Lead (250-300) = exp[ (ln( Lead 250-300) x 0.700) ] OC = exp[ (ln(OC) x 0.916) ] * August 26, 2014All tests using VUXO Hardware Multiply Average Cylinder Liner Wear by 0.566 = exp[ (ln(Lead) x 0.797) ] Lead (250-300) = exp[ (ln( Lead 250-300) x 0.700) ] OC = exp[ (ln(OC) x 0.916) ] August 26, 2014 *** All tests using VUXO Hardware Multiply Average Top Ring Weight Loss by 0.719 Multiply Average Cylinder Liner Wear by 0.818 = exp[ (ln(Lead) x 0
4 .813) ] Lead (250-300)![.813) ]
Lead (250-300)](846903/813-lead-250-300-exp-ln-lead-250-300-x-0.jpg ".813) ]
Lead (250-300)")
.813) ] Lead (250-300) = exp[ (ln( Lead 250-300) x 0.710) ] OC = exp[ (ln(OC) x 0.913) ] August 4, 2015 *** All test using VUXOA or VUXOB HardwareMultiply Average Top Ring Weight Loss by 0.912 Lead (250-300) = exp[ (ln( Lead 250-300) x 0.895) ] = exp[ (ln(Lead) x 0.954) ] OC = exp[ (ln(OC) x 0.942) ] February 25, 2016 *** All test using VUYPxMultiply Average Top Ring Weight Loss by 0.912 Multiply Average Cylinder Liner Wear by 0.970 � 65.0 Lead(250-300) = exp[ (ln(Lead(250-300) + (65.0 - OC) x 0.04021) ] 65.0 Lead(250-300) � 65.0 = exp[ (ln(Lead) + (65.0 - OC100-300) x 0.03088 ] 65.0 FinalLead History of Industry Correction Factors Appendix B B-2 10-2016 Area Condition From To VIII None All Tests None Area Condition Description From To
5 1M-PC None All Tests None 1N May 1,
1M-PC None All Tests None 1N May 1, 2004 September 27, 2005All Tests Add -1.135 to ln(TLHC+1) September 28, 2005 March 31,2015 All Tests Add -0.451 to ln(TLHC+1) April 1,2015 *** All Tests on 1Y3998 Liners 1P None All Tests None 1R None All Tests None C13 None All Tests None ISB April 21, 2011 *** All tests using batch B tappets with batch E, F, and G cams Multiply ATWL by 0.637; Add -9.5 to ACSW ISB December 11, 2011 November 12, 2012All tests using batch C tappets with batch H cams ISB November 13, 2012 *** All tests using batch C tappets with batch H and J cams Multiply ATWL by 0.711; Add -5.6 to ACSW ISM June 28, 2007 *** March 4, 2010 ***All Tests Add +1.3 to Crosshead Wear At 3.9% Soot April 30, 2011 ***All Tests Add +2.5 to Crosshead Wear At 3.9% Soot November 19, 2013 ***All Tests Add -0.200 to ln(SAIAS) October 1, 2014 *** All Tests Add 4 kPa to Oil Filter Delta Pressu