
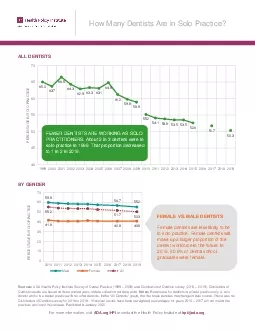
MaleFemaleAll650637665643629633631648612598589552541538535535526517503ALL DENTISTSFEWER DENTISTS ARE WORKING AS SOLO PRACTITIONERS About 2 in 3 dentists were in solo practice in 1999 That proportion d ID: 880908
Download Pdf The PPT/PDF document "598567552418408408552517503PERCENTAGE IN..." is the property of its rightful owner. Permission is granted to download and print the materials on this web site for personal, non-commercial use only, and to display it on your personal computer provided you do not modify the materials and that you retain all copyright notices contained in the materials. By downloading content from our website, you accept the terms of this agreement.


1 59.856.755.241.840.840.855.251.750.3PERC
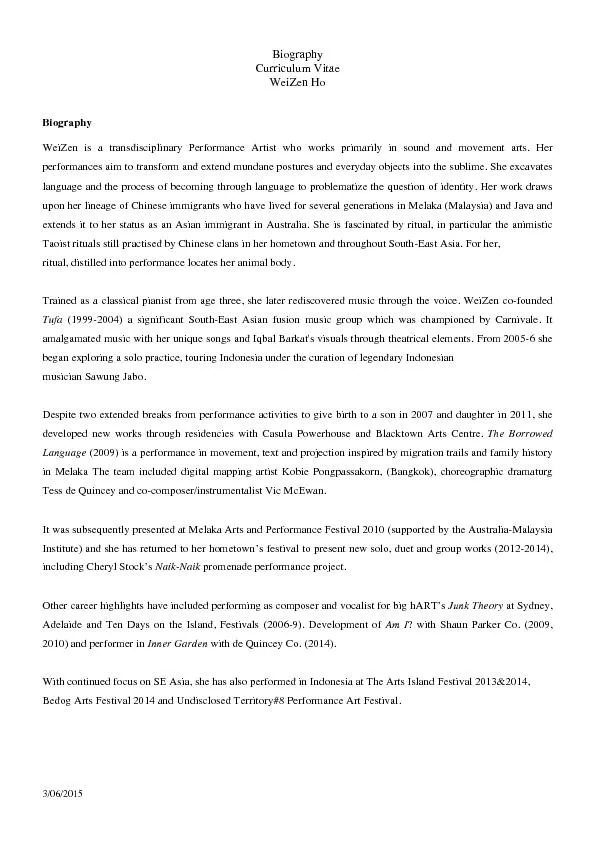
59.856.755.241.840.840.855.251.750.3PERCENTAGE IN SOLO PRACTICE Male Female All 65.063.766.564.362.963.363.164.861.259.858.955.254.153.853.553.552.651.750.3 ALL DENTISTS FEWER DENTISTS ARE W ORKING AS SOLO PRACTITIONERS. About 2 in 3 dentists were in solo practice in 1999. That proportion decreased to 1 in 2 in 201 9 . FEMALE VS. MALE DENTISTS Female dentists are less likely to be in solo practice. Female dentists will make up a larger proportion of the dentist workforce in the future. In 50.6% of dental school graduates were female. BY GENDER For more information, visit ADA.org/HPI or contact the Health Policy Institute at hpi@ada.org . How Many Dentists Are in Solo Practice? Sources: – 2009) and Distribution of Dentists survey (2010 – 201 9 ). Distribution of Dentists results are based on three pooled years of data collection per data point.NoteResults are for dentists in private practice only.A solo dentist works in a dental practice with no other dentists. In the “All Dentists” graph, the line break deno
2 tes the change in data source. There was
tes the change in data source. There was no Distribution of Dentists survey for 2016or 2018Historical results have been reweighted; percentages for years 2010 2017 will not match the previous version of this release. Published in January 2021. BY STATE 201 9 For more information, visit ADA.org/HPI or contact the Health Policy Institute at hpi@ada.org . How Many Dentists Are in Solo Practice? Notes: In graph By State, the d iamond - “Whisker” data points represent the 95% confidence interval for the estimated share. Results are for dentists in private practice only. A solo dentist works in a dental practice with no other dentistsHistorical results have been reweighted; percentages for years 2010 2017 will not match the previous version of this release. DENTISTS ARE INCREAS INGLY PRACTICING IN GROUPSPARTICULARLY YOUNGERDENTISTS. In 201, only 1 in dentists under 35 was in solo practice. BY AGE 28.625.149.542.562.0 57.4 65.762.361.961.555.250.3PERCENTAGE IN SOLO PRACTICE Age 35 Age 35 Age 45 Age 55 Age 65 + All age